Infographics
Sea level rise will affect every aspect of our world from geographical to economical. These infographics from the IPCC AR5 and The Climate Reality Project illustrate the impact in a colorful way.
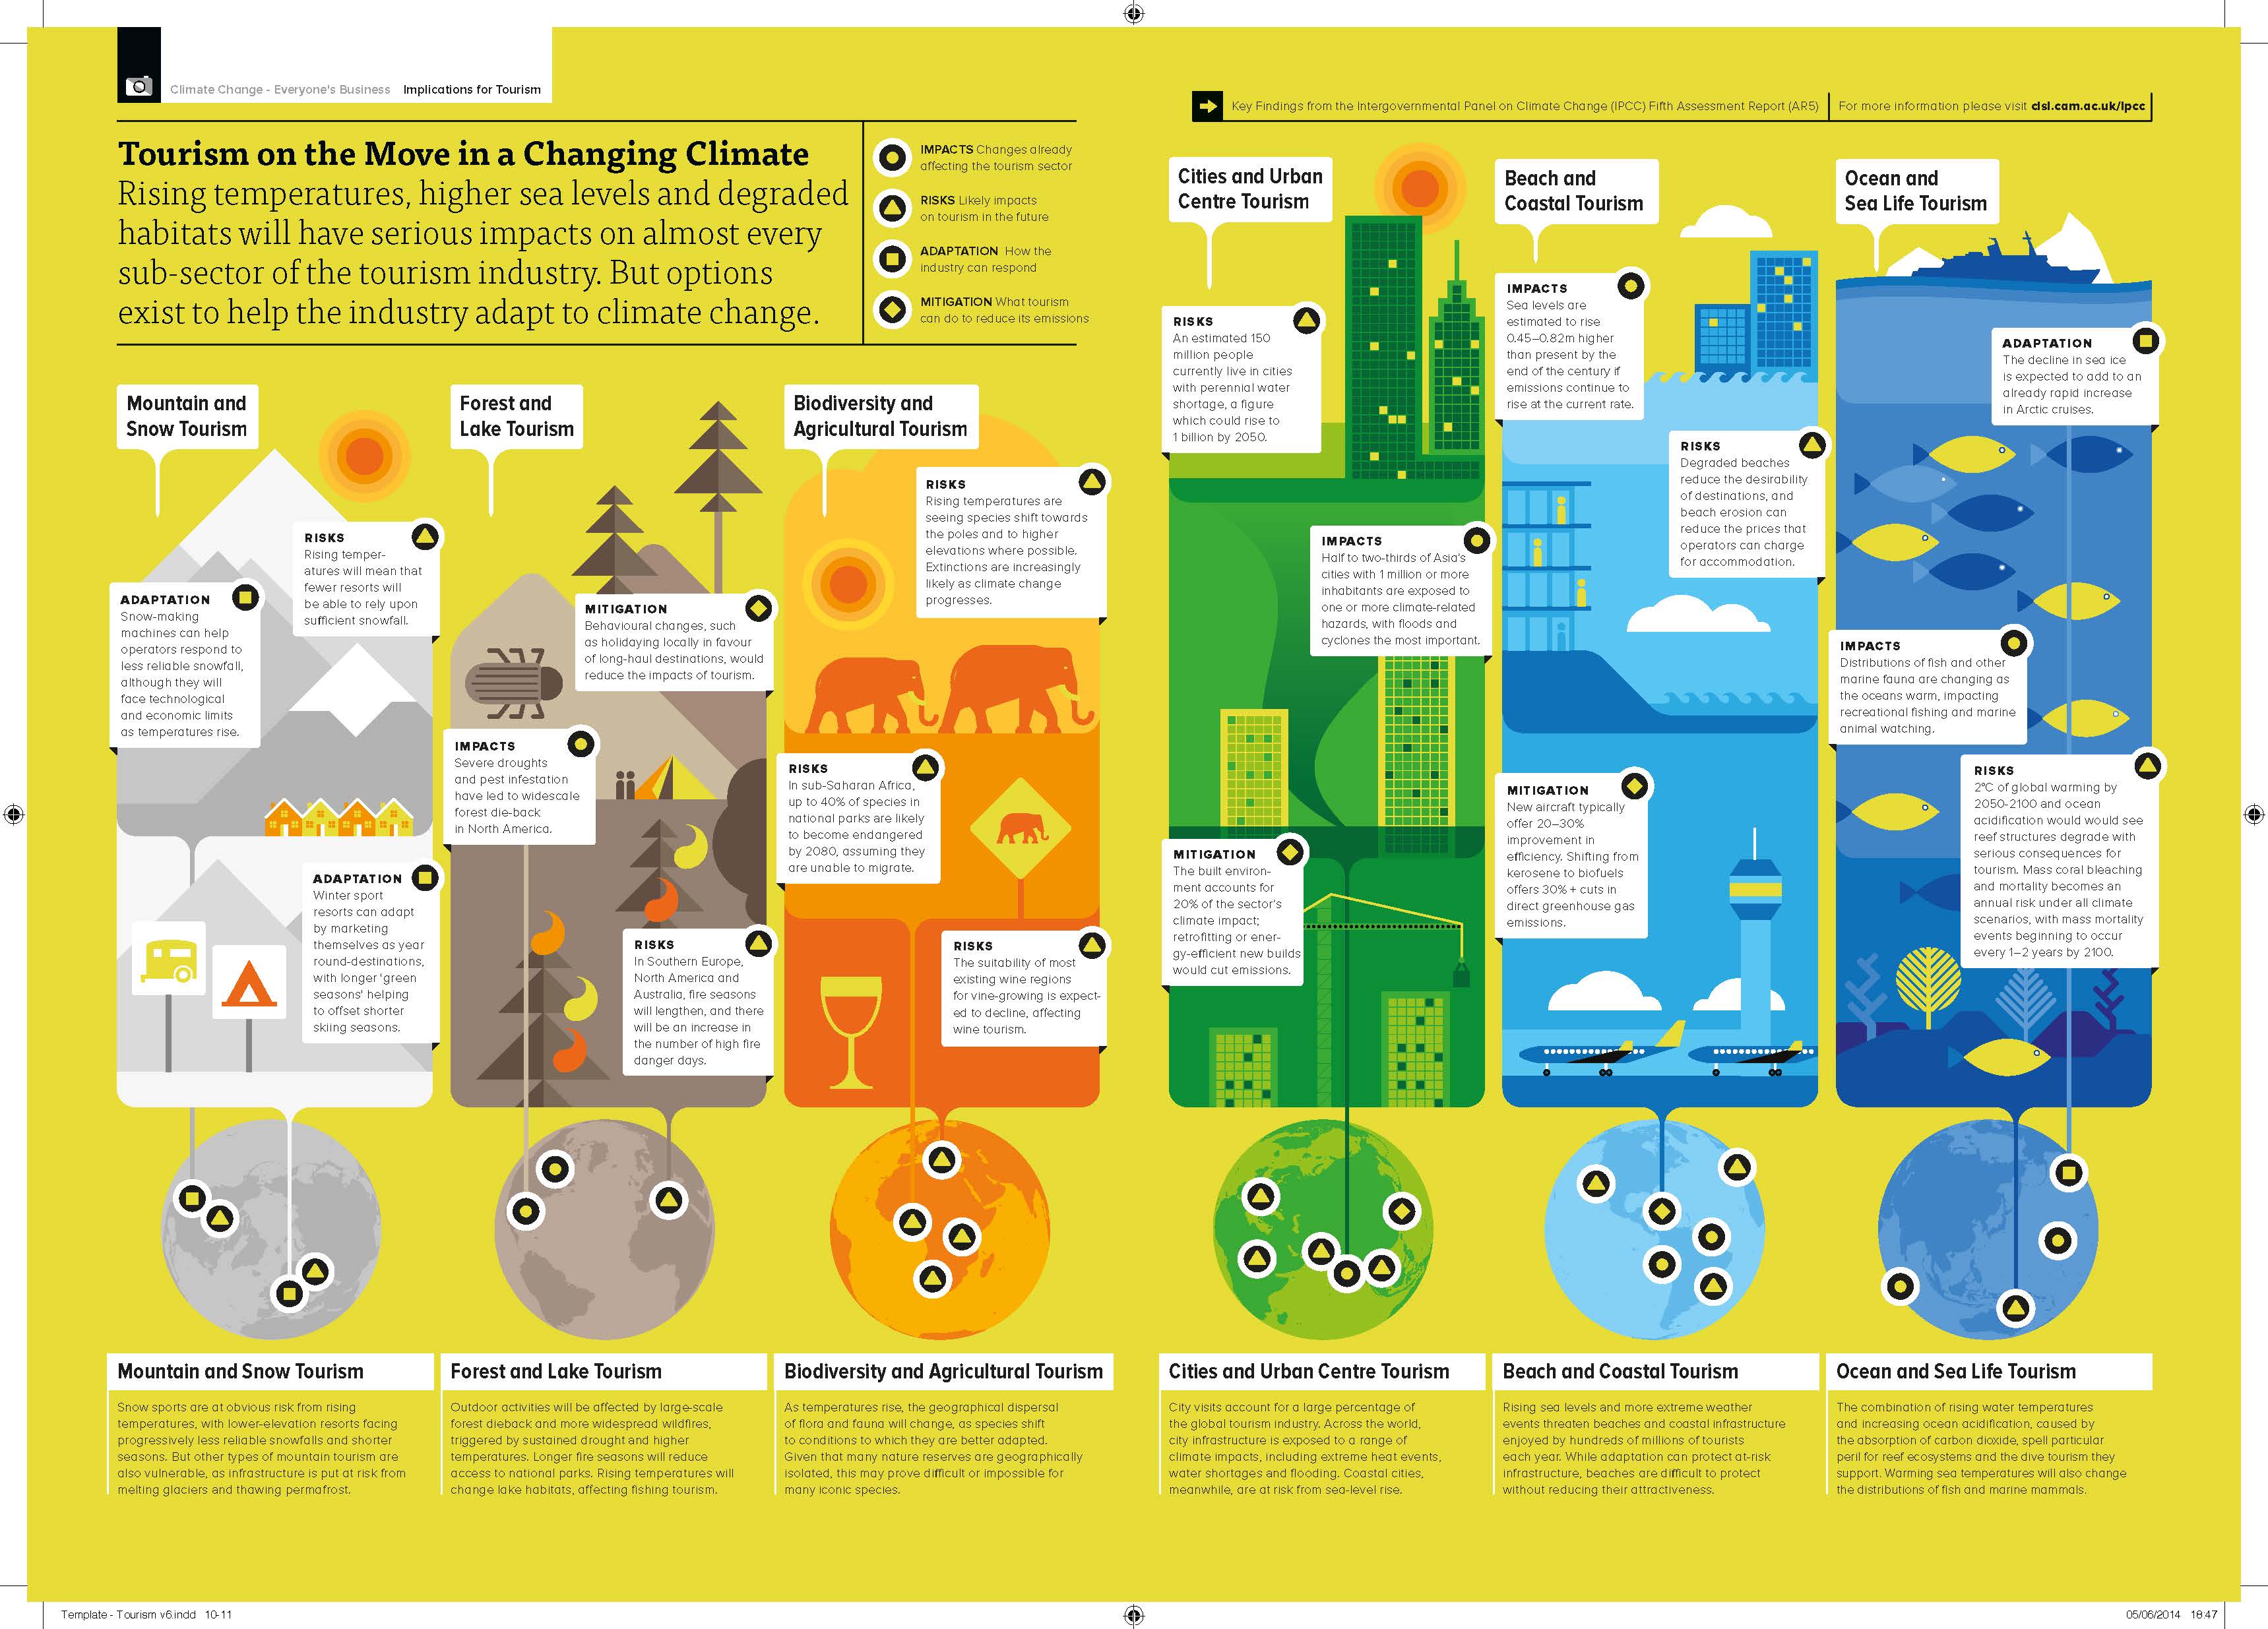
Thanks to the Cambridge Institute for Sustainability Leadership (CISL) at Cambridge University and Former Vice President Al Gore’s Climate Reality Project for taking the technical data that is sometimes hard to understand and making it much easier to digest as well as so colorful and pretty.
To learn more about Cambridge’s Institute for Sustainability Leadership, visit http://www.cisl.cam.ac.uk/business-action/low-carbon-transformation/ipcc-briefings/faqs.
To learn more about The Climate Reality Project, visit https://www.climaterealityproject.org/our-mission.
| EIGHT GREAT INFOGRAPHICS ON CLIMATE CHANGE: | |||
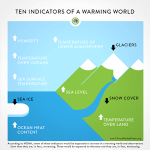
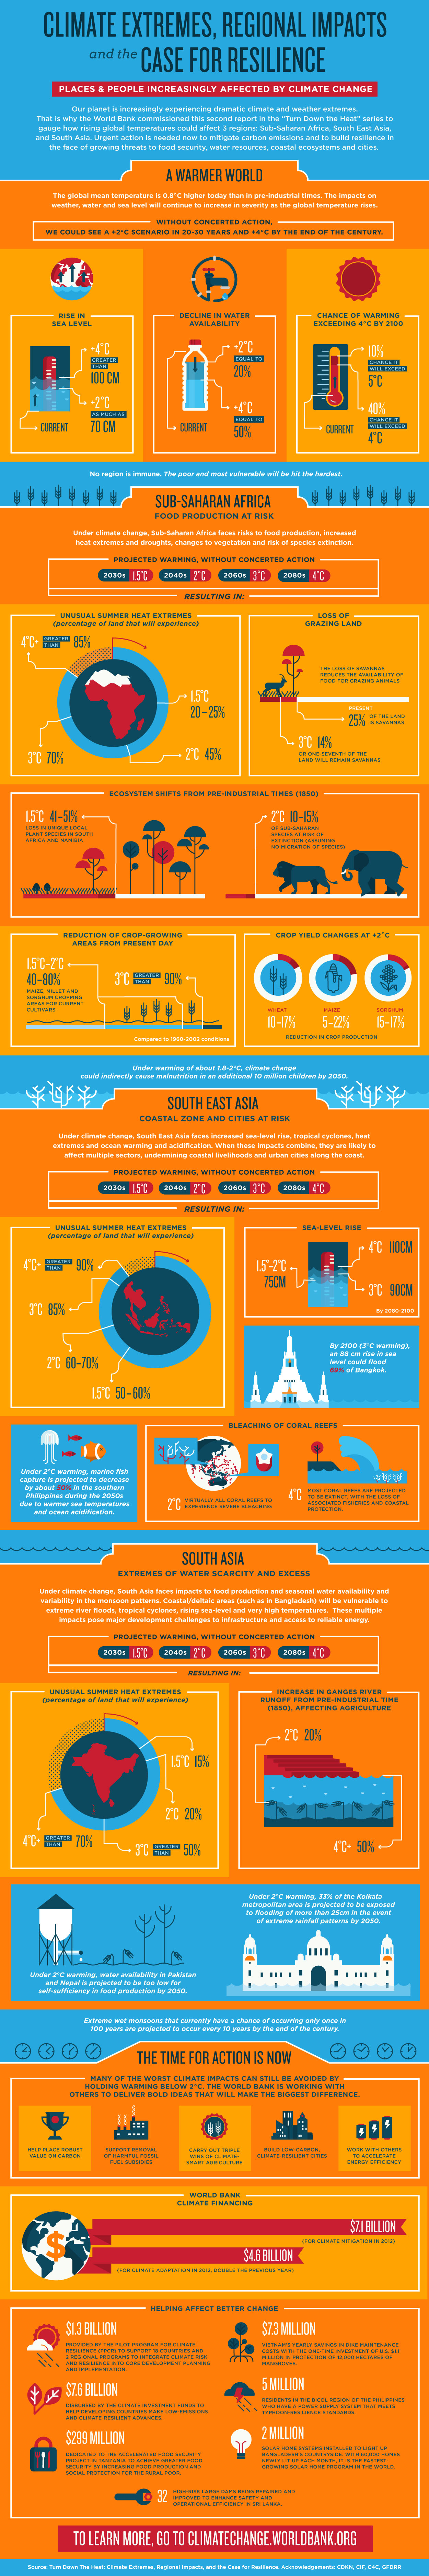
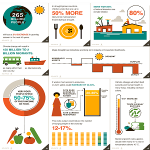
| Ten Indicators of a Warming World | Case for Resilience | Climate Impact on People | Brief History of UNFCCC COP Meetings |
 |
 |
 |
 |
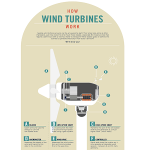
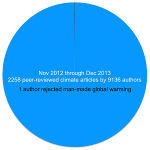
| Solutions Project: 50 States/50 Plans | How Wind Turbines Work | Water-Energy Nexus | Scientists Who Doubt Human-Caused Climate Change |
 |
 |
 |
 |
Source: The Climate Reality Project
| HOW CLIMATE CHANGE AFFECTS YOUR HEALTH: | |||
| Extreme Weather | Air Quality | Vector-Borne Diseases | Rising Temperatures |
 |
 |
 |
 |
Source: ThinkProgress
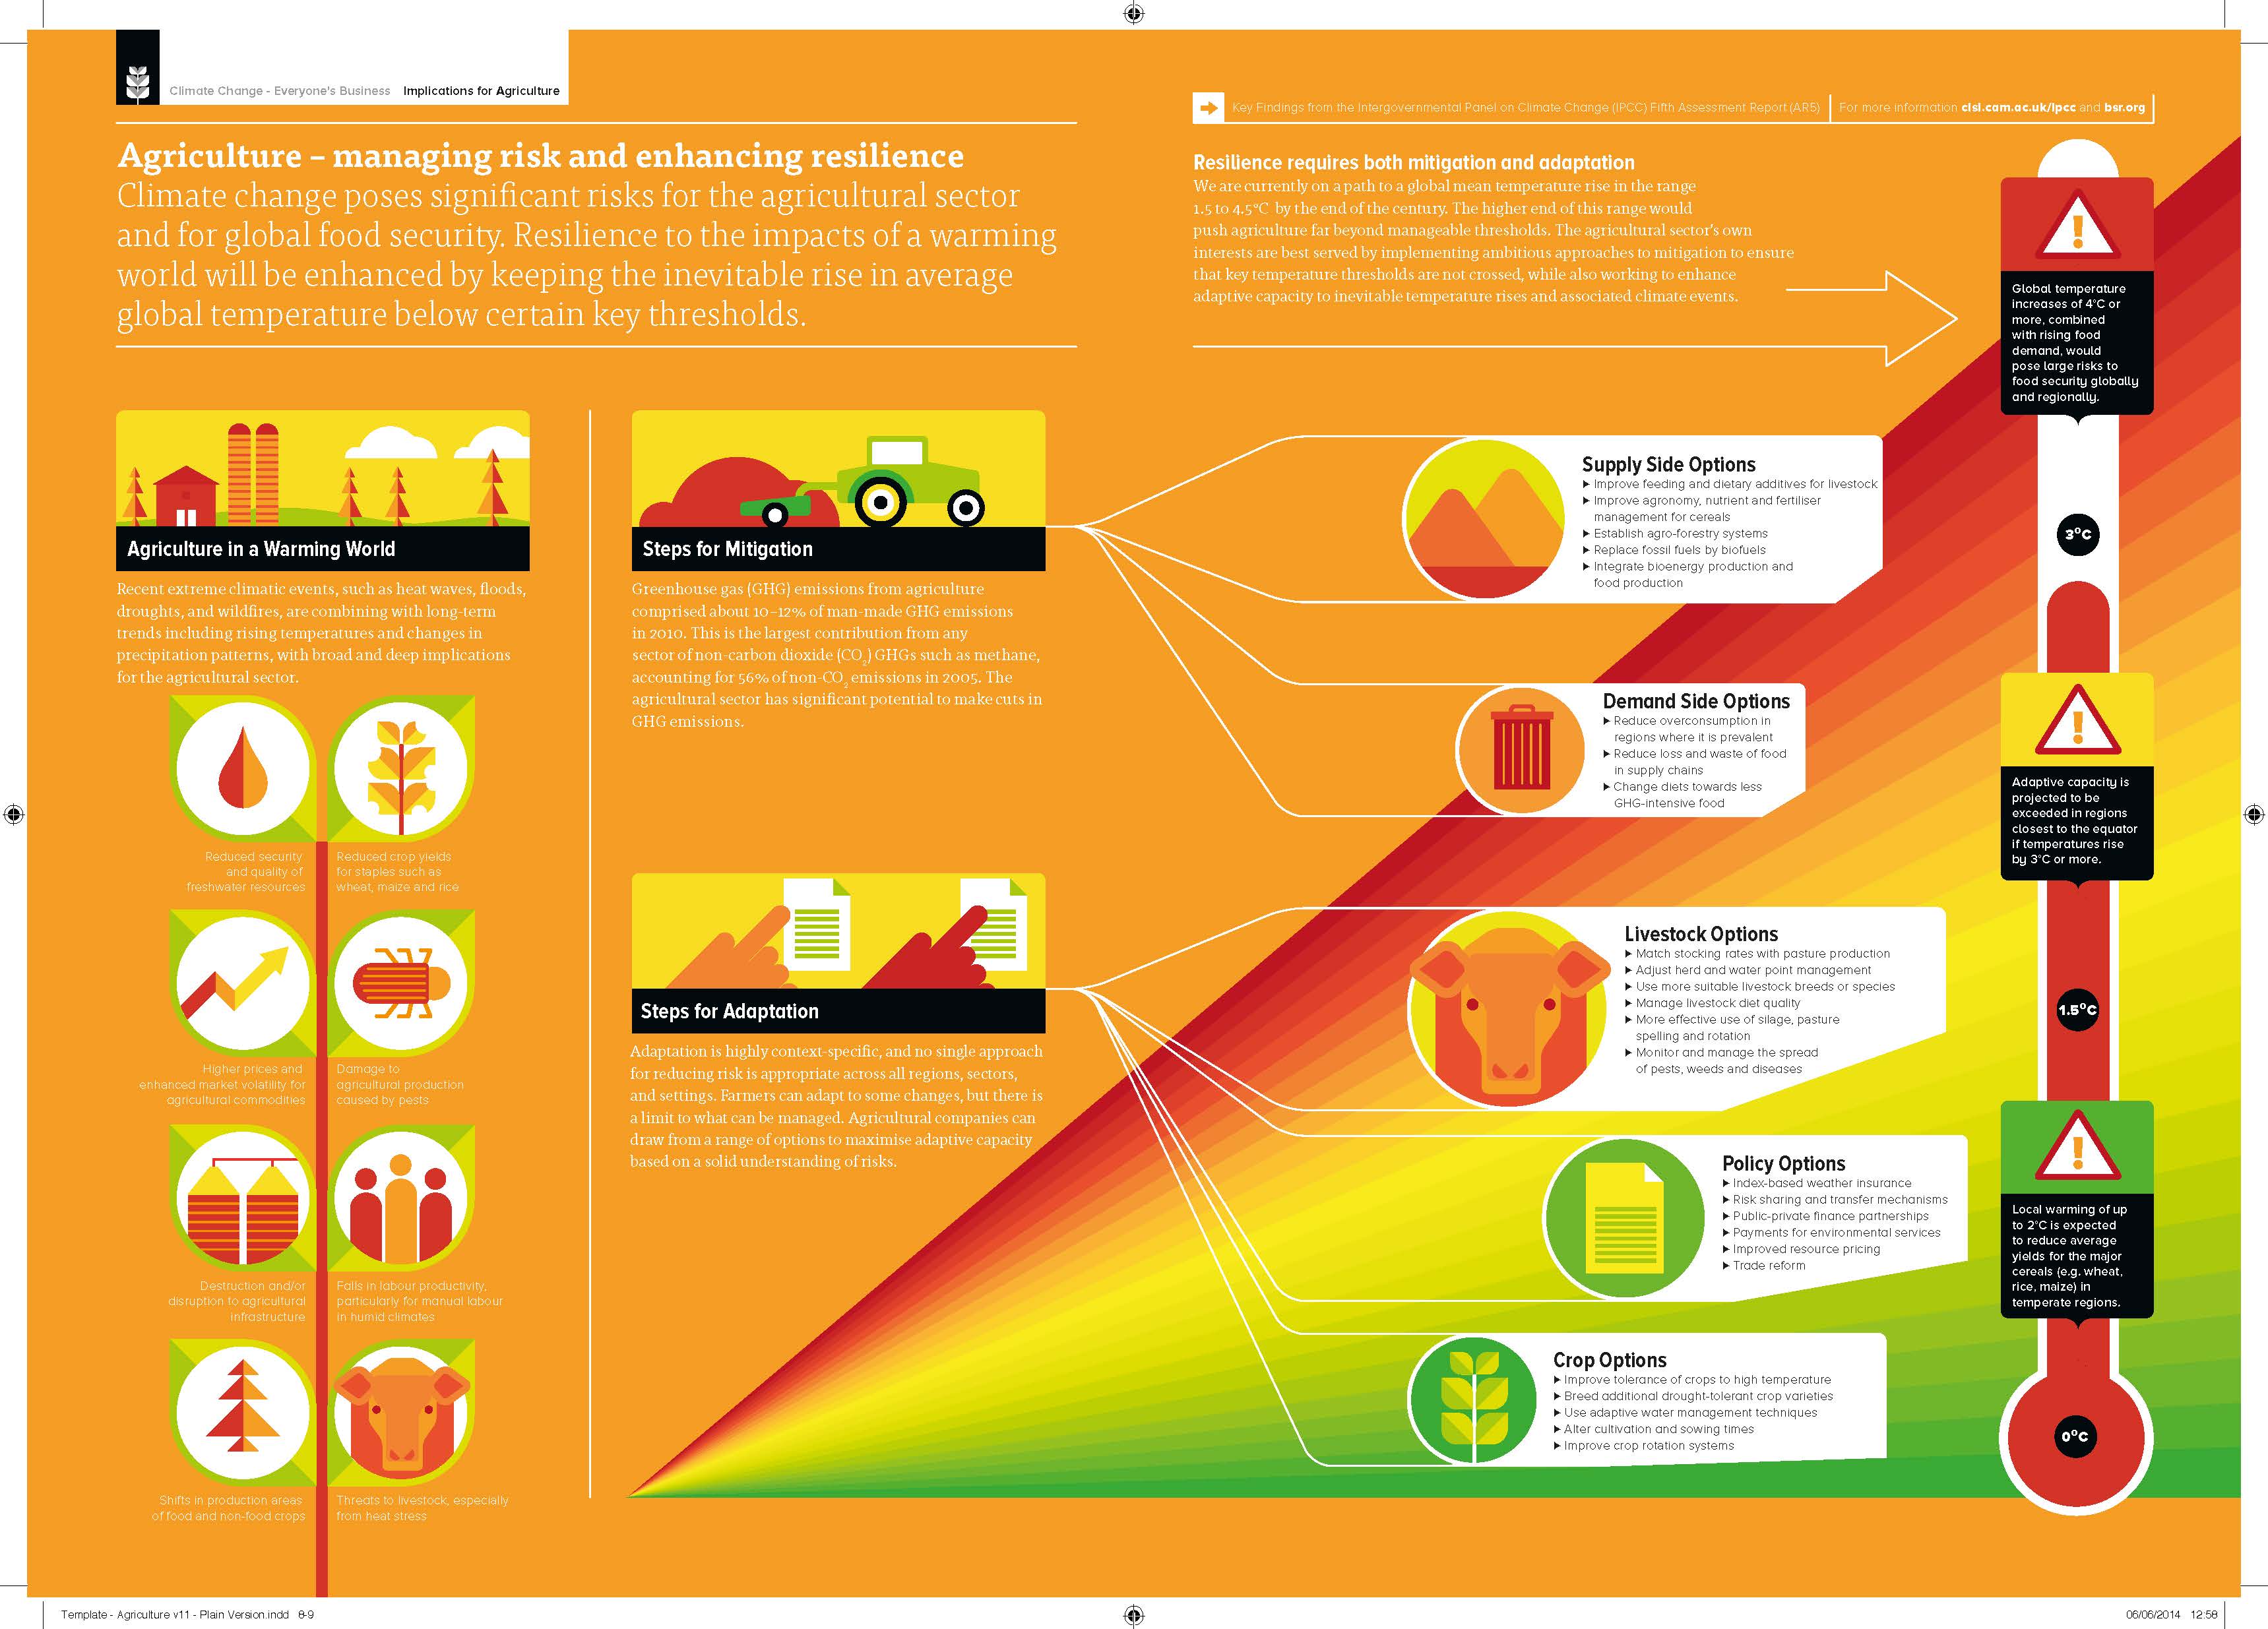
| Implications For Agriculture |
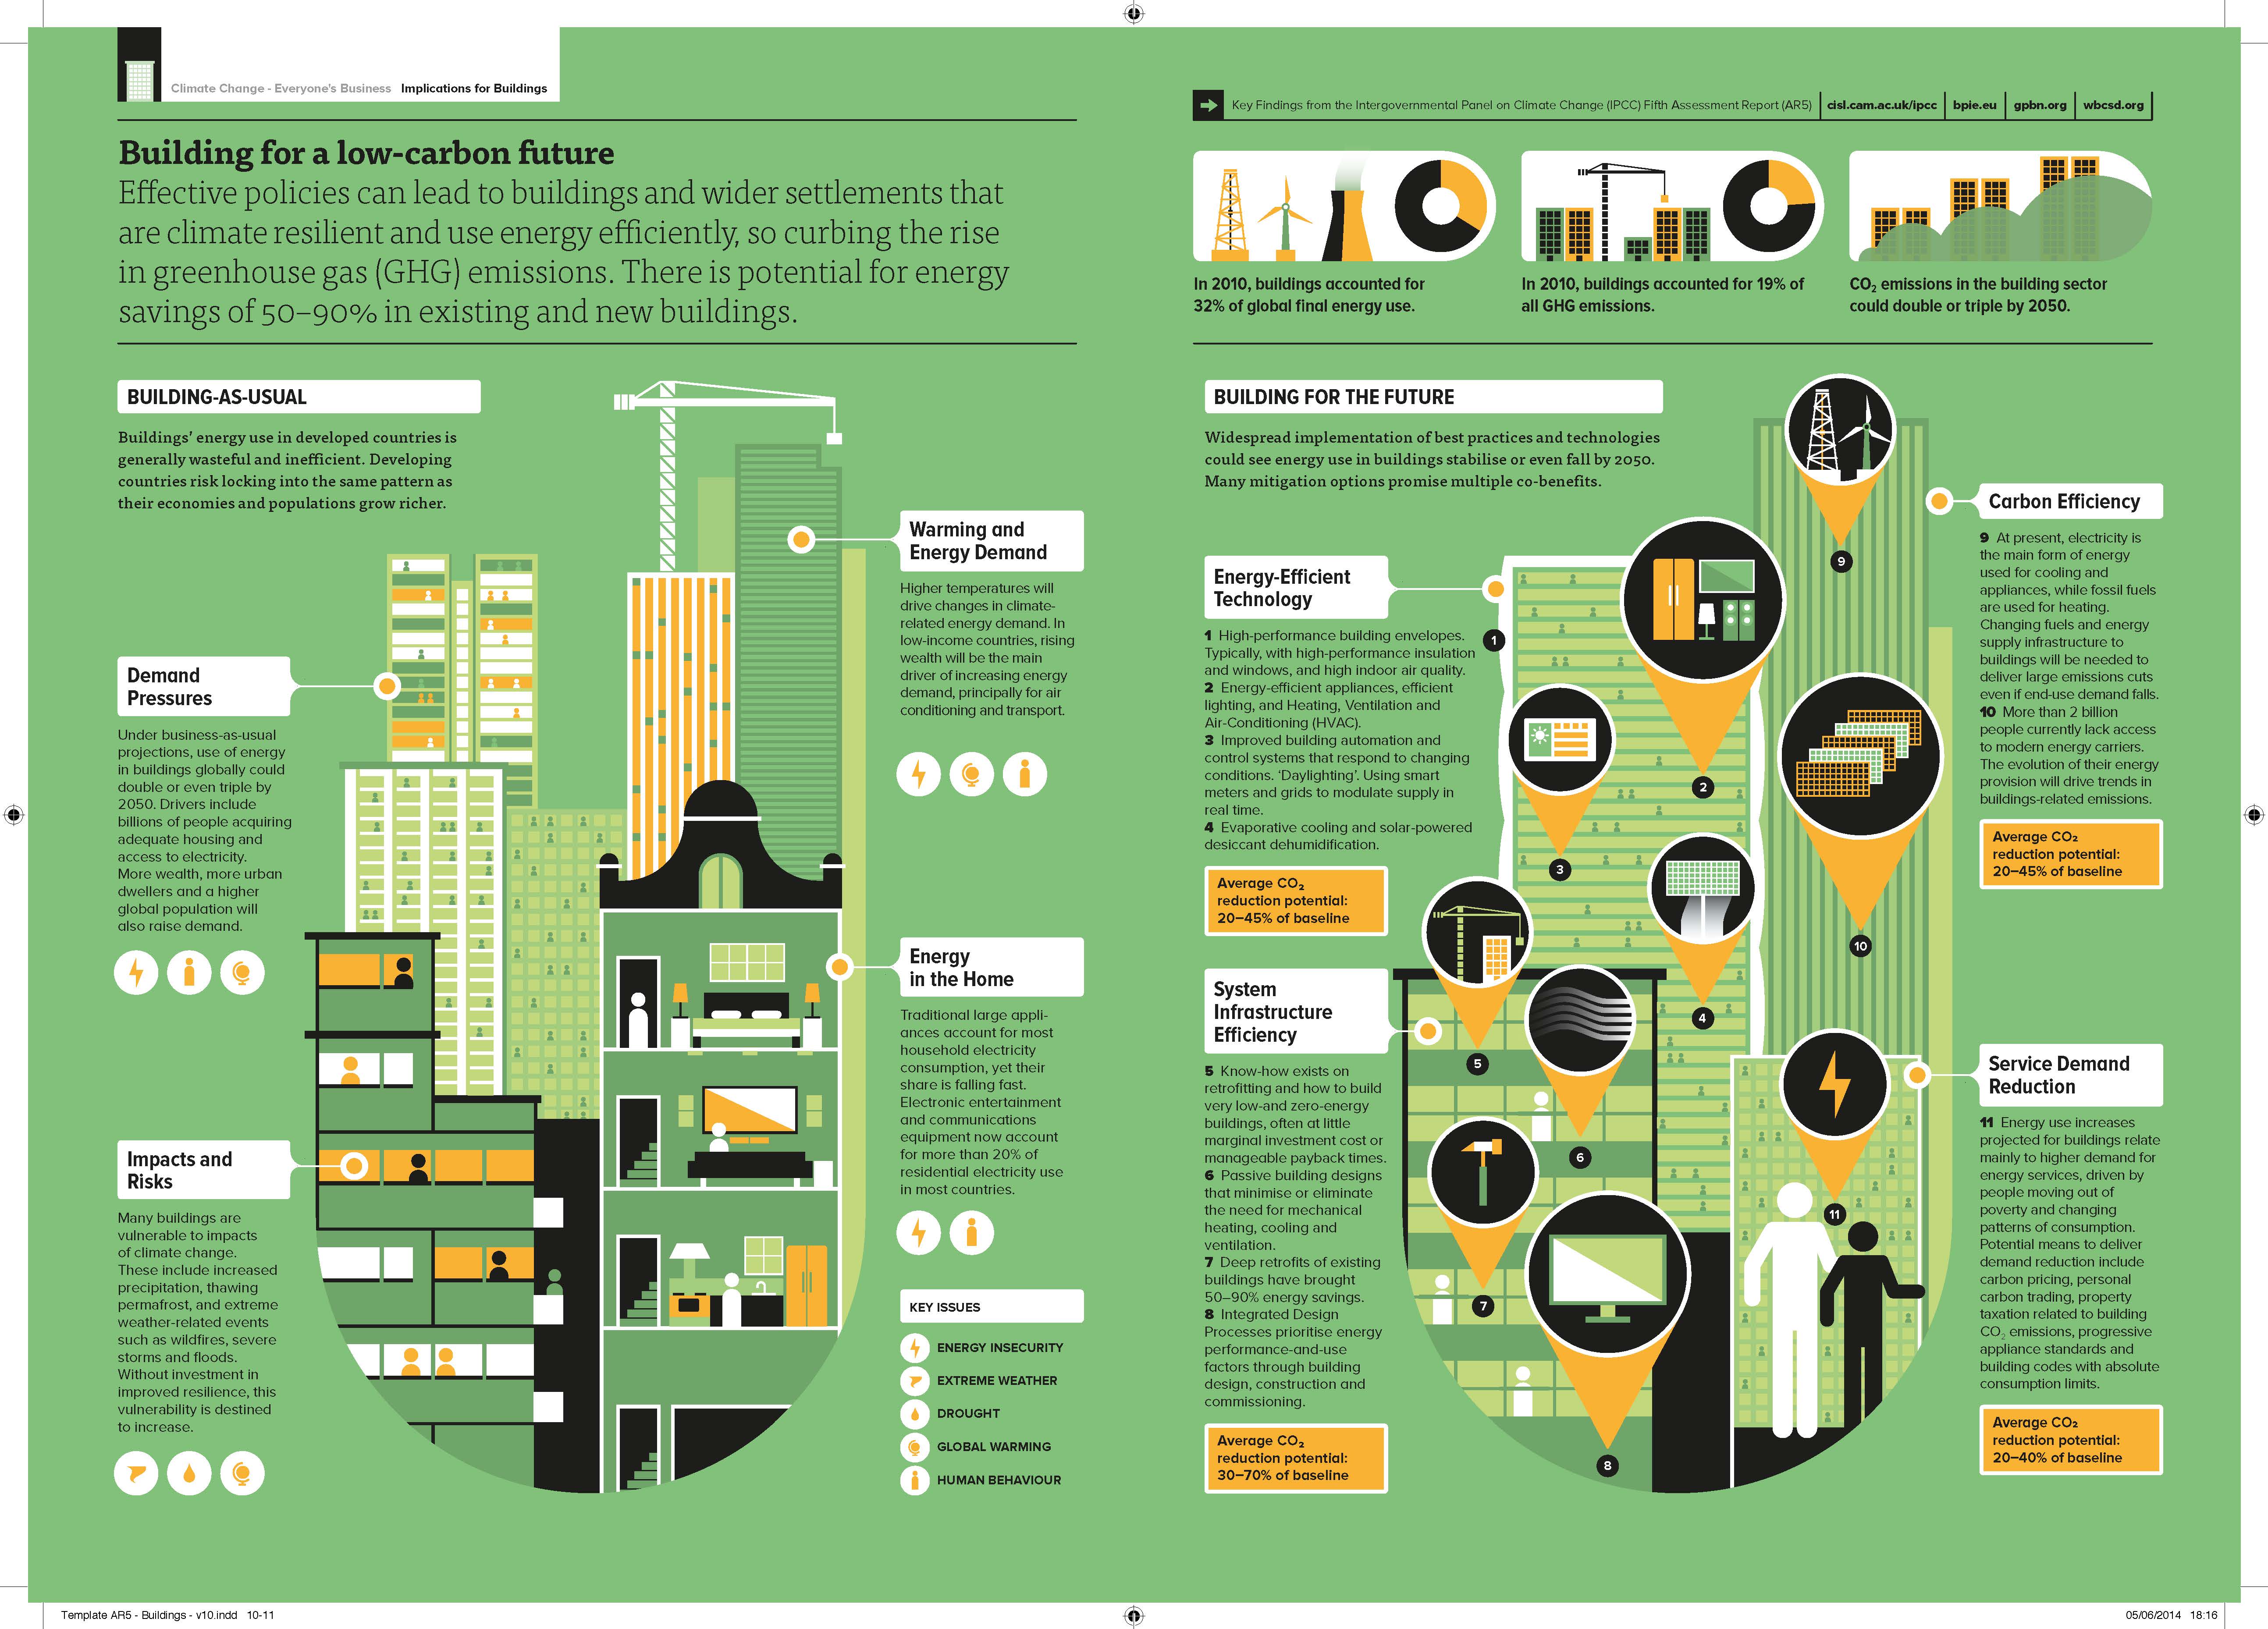
Implications For Buildings |
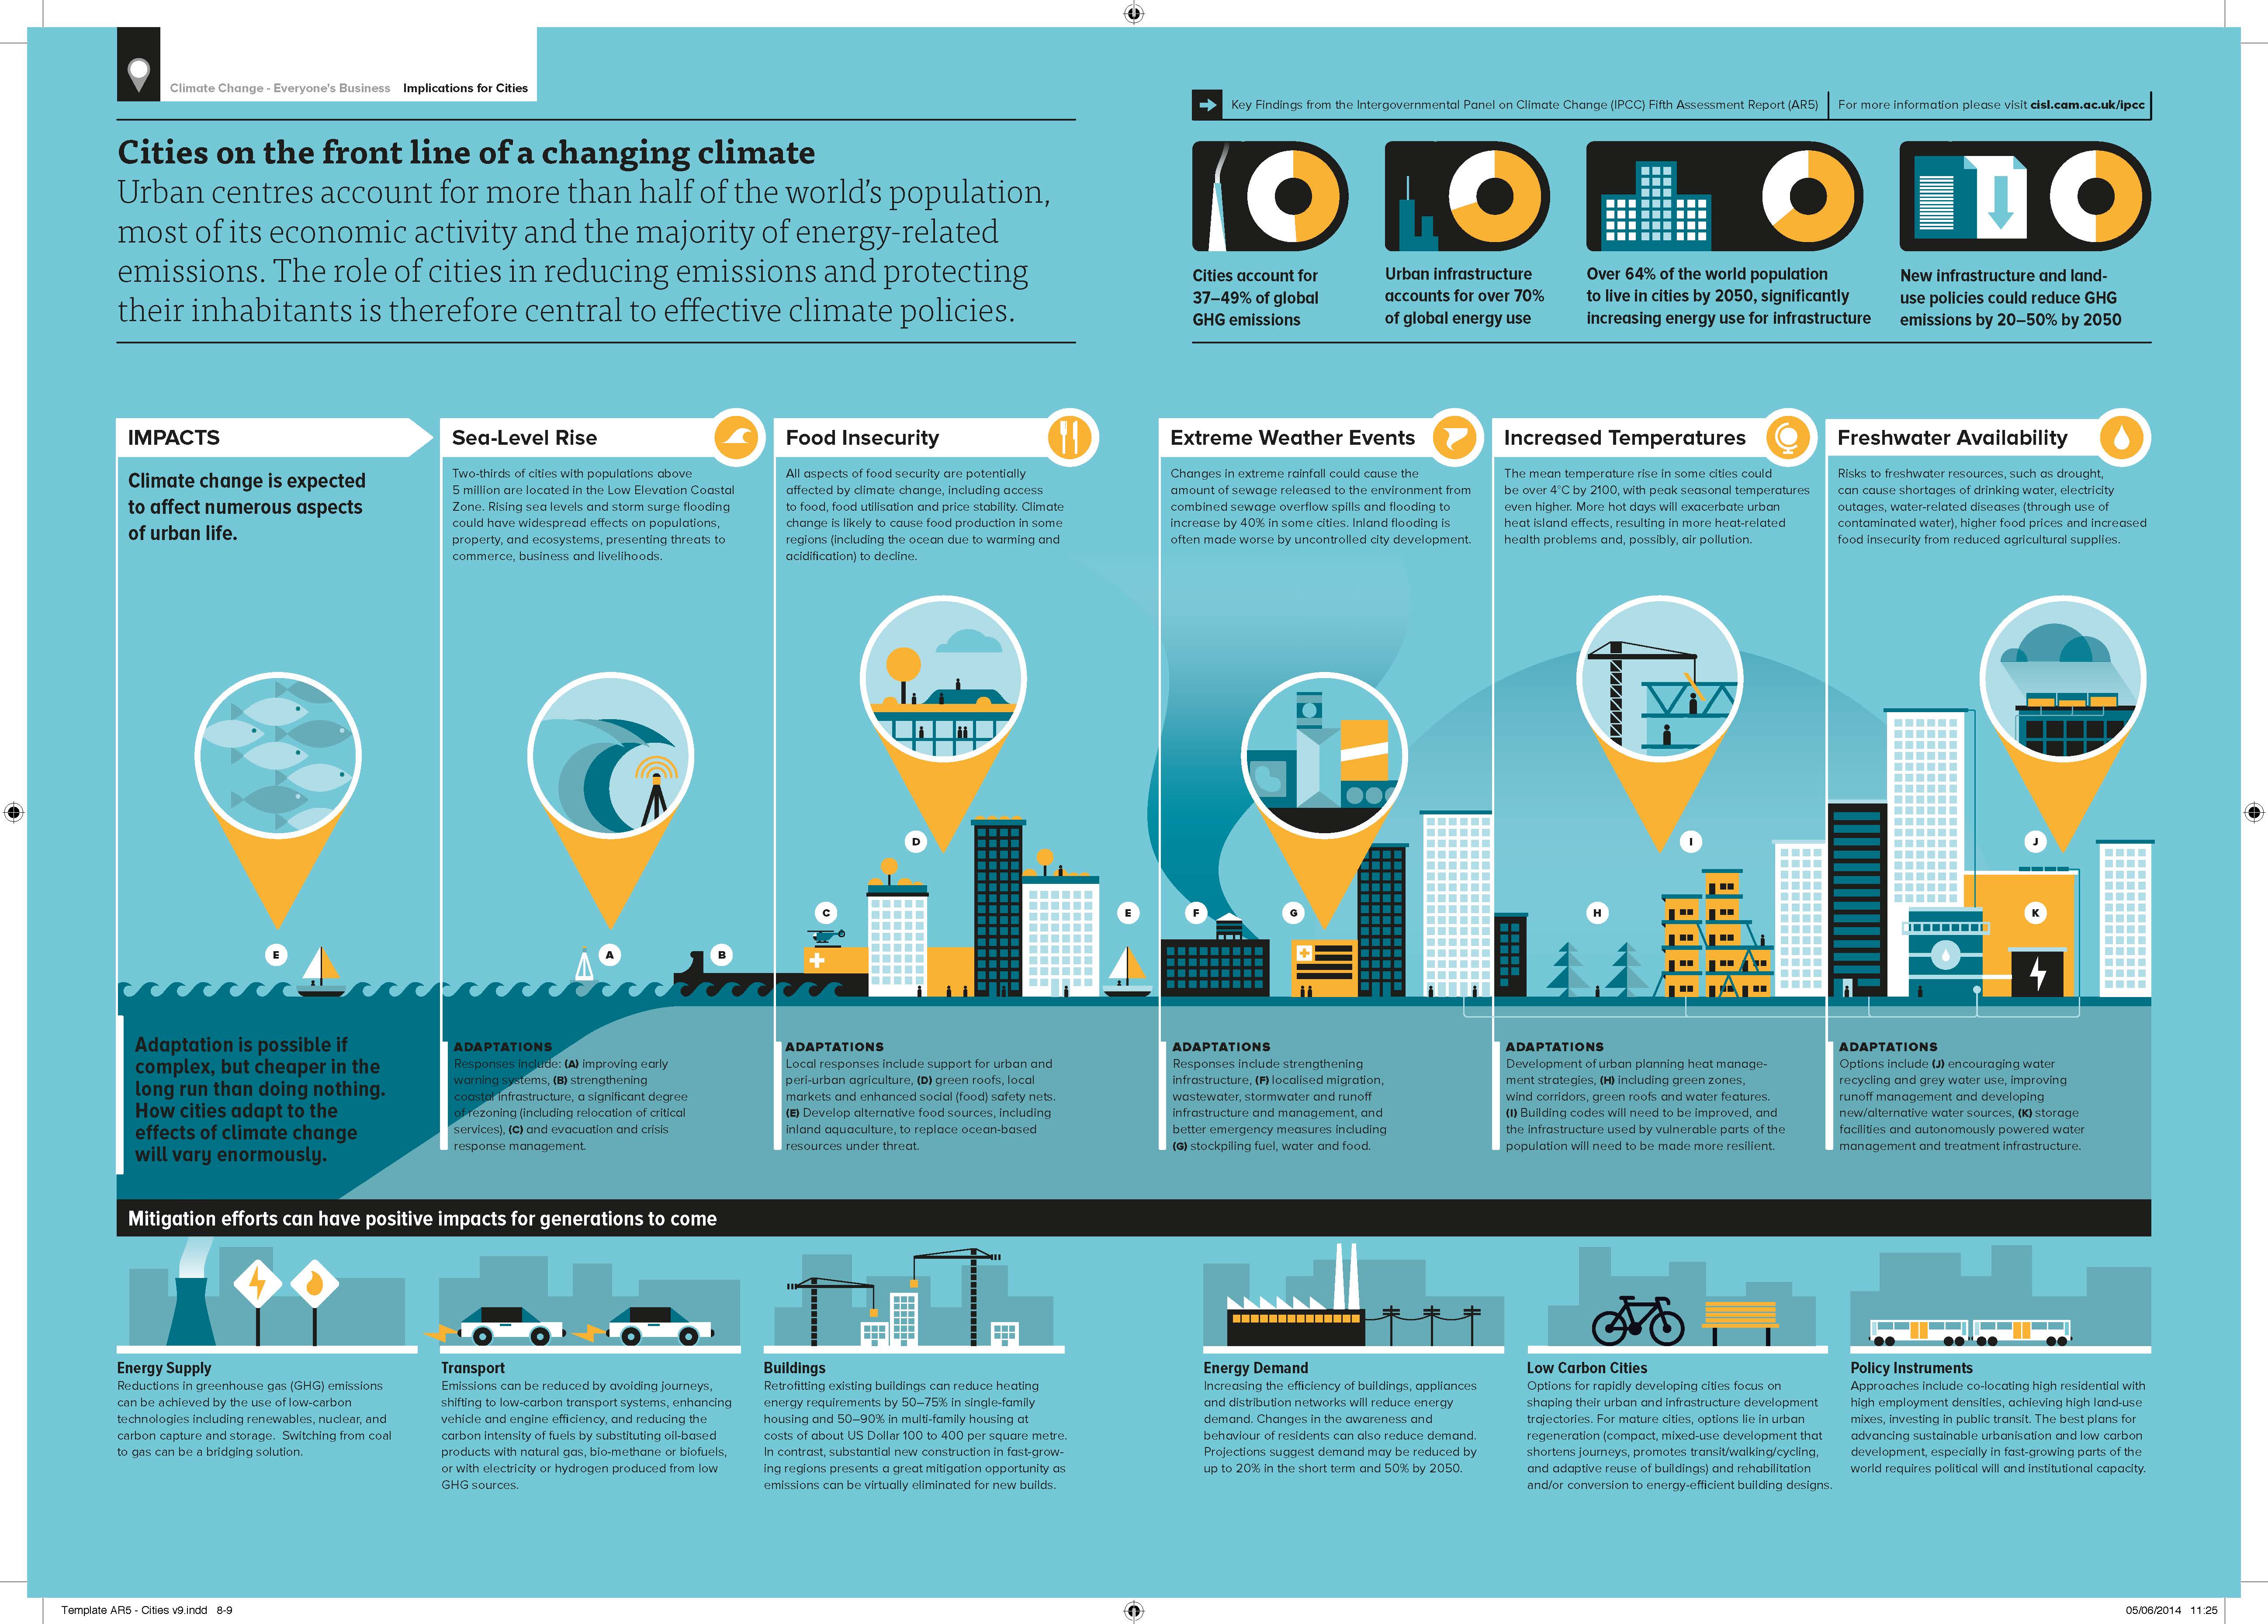
Implications For Cities |
Implications Overview |
 |
 |
 |
 |
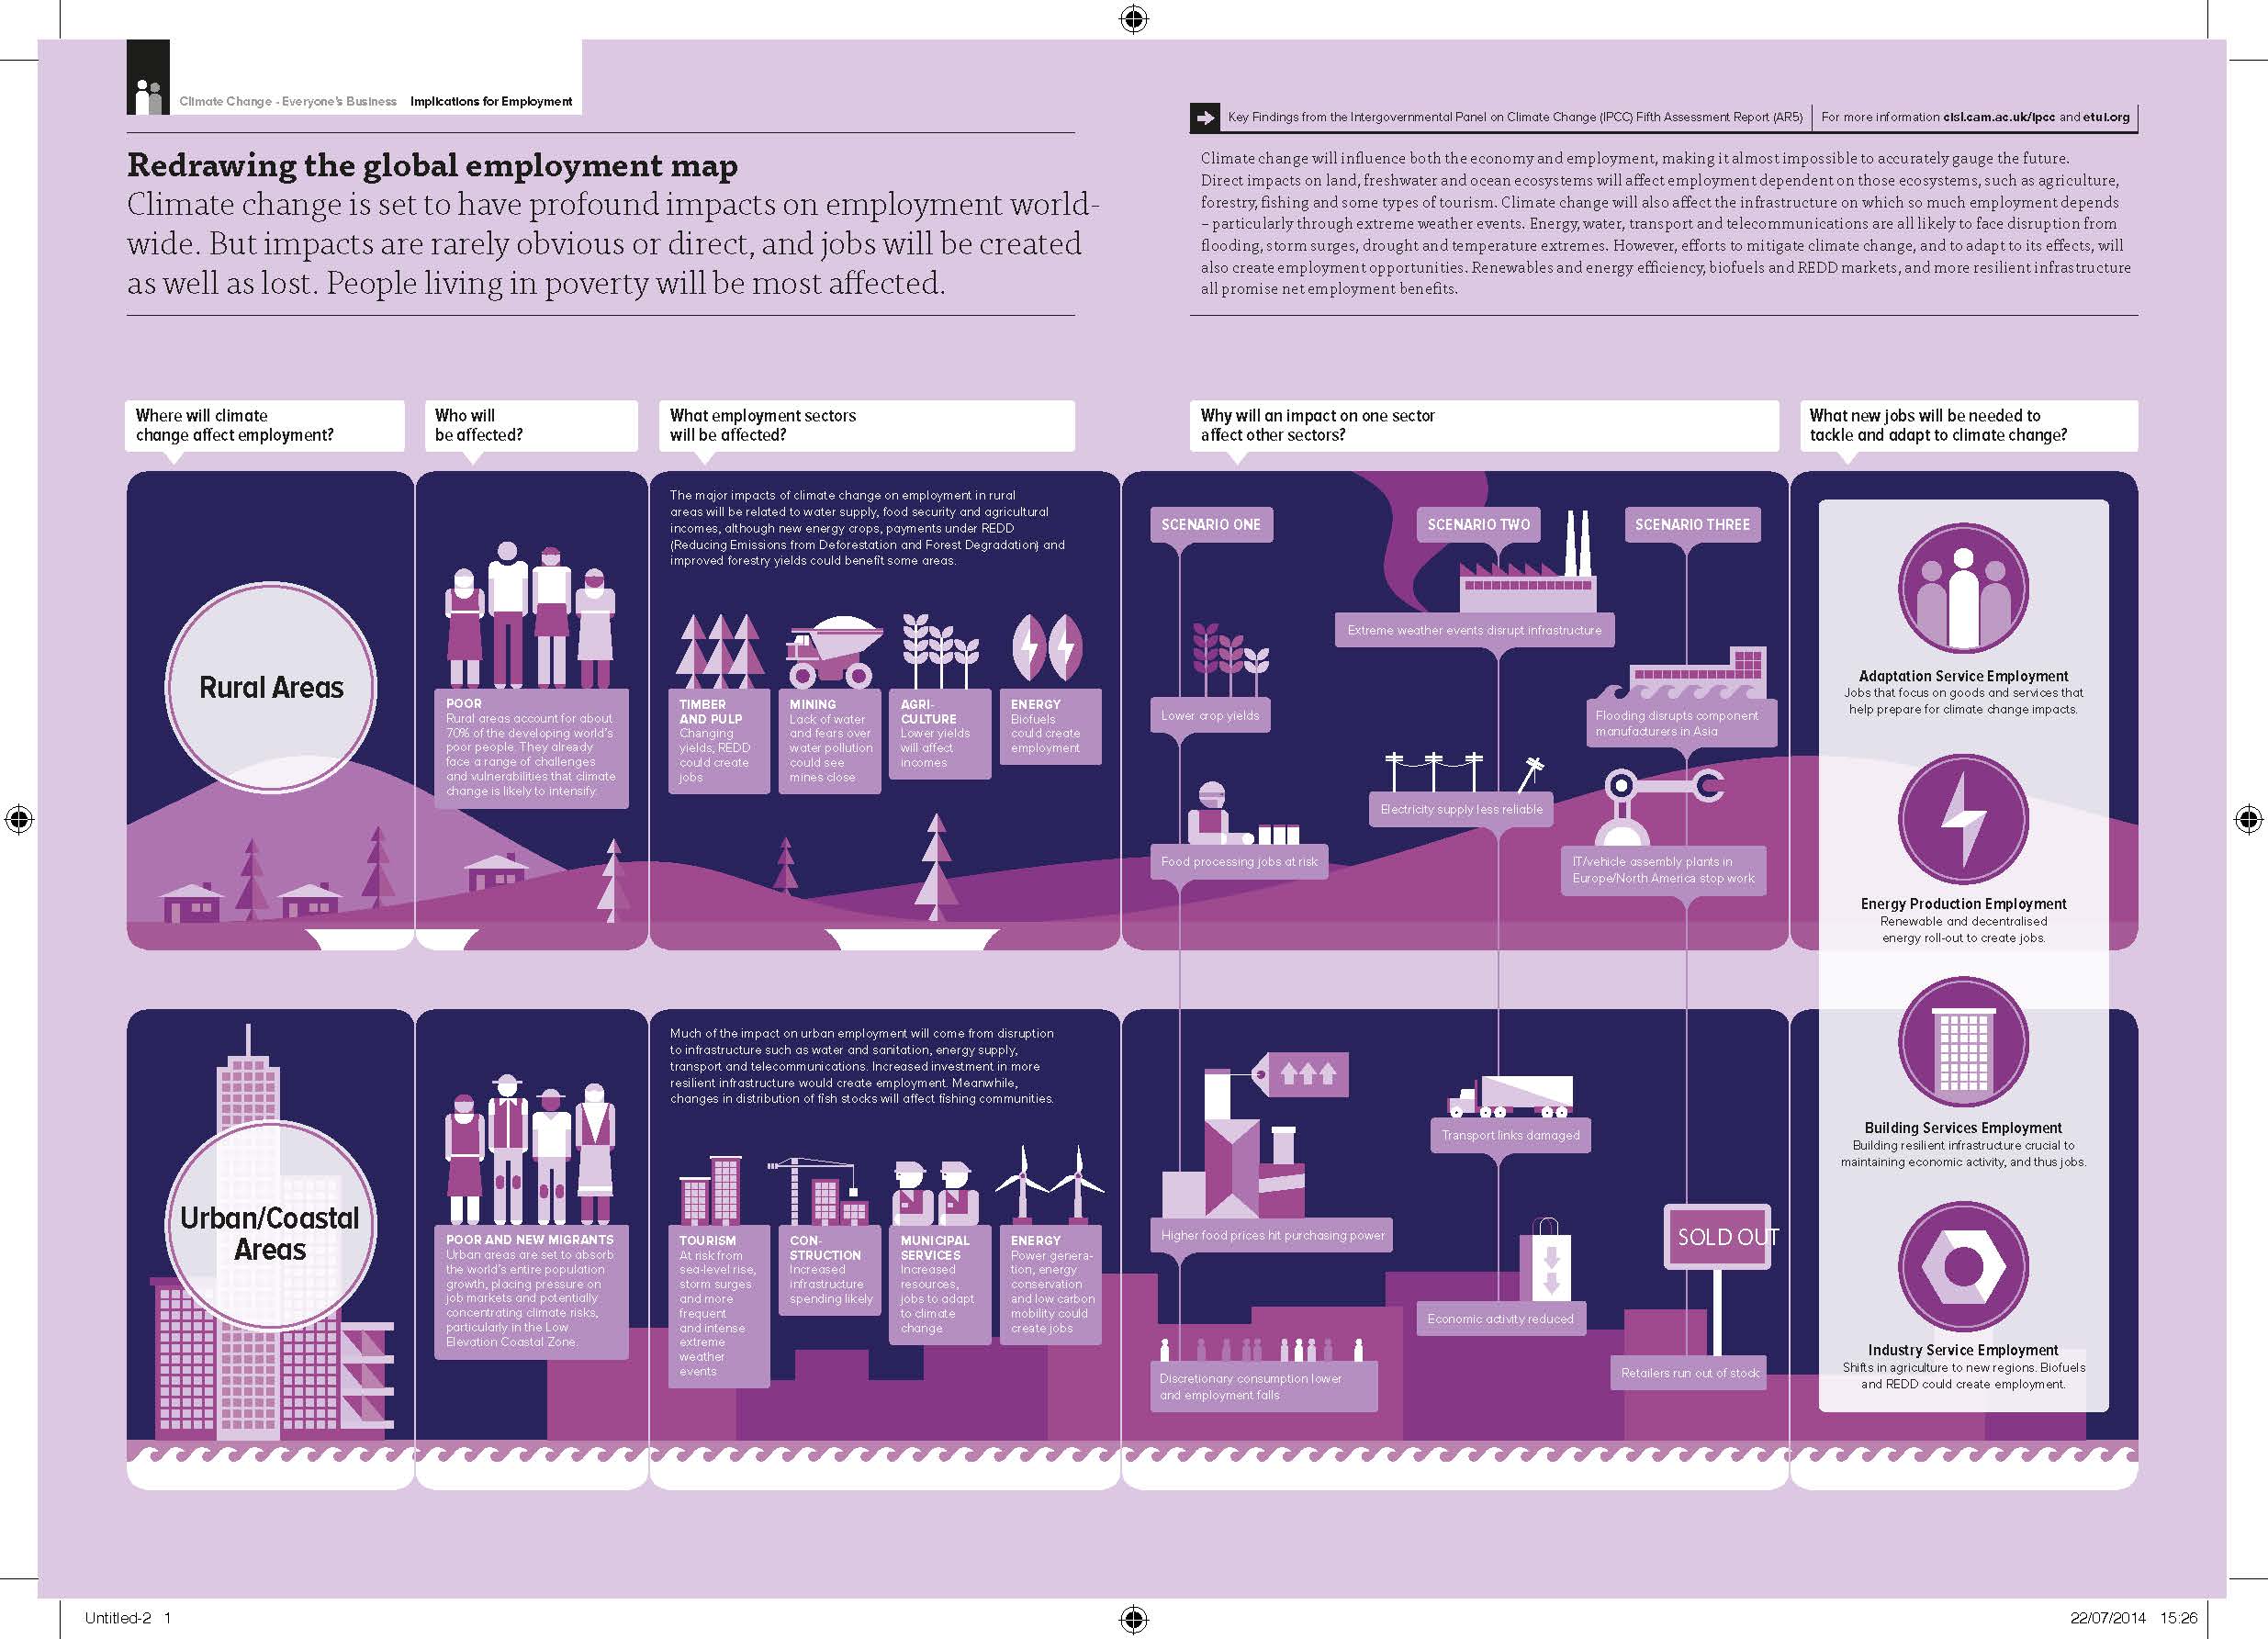
| Implications For Employment |
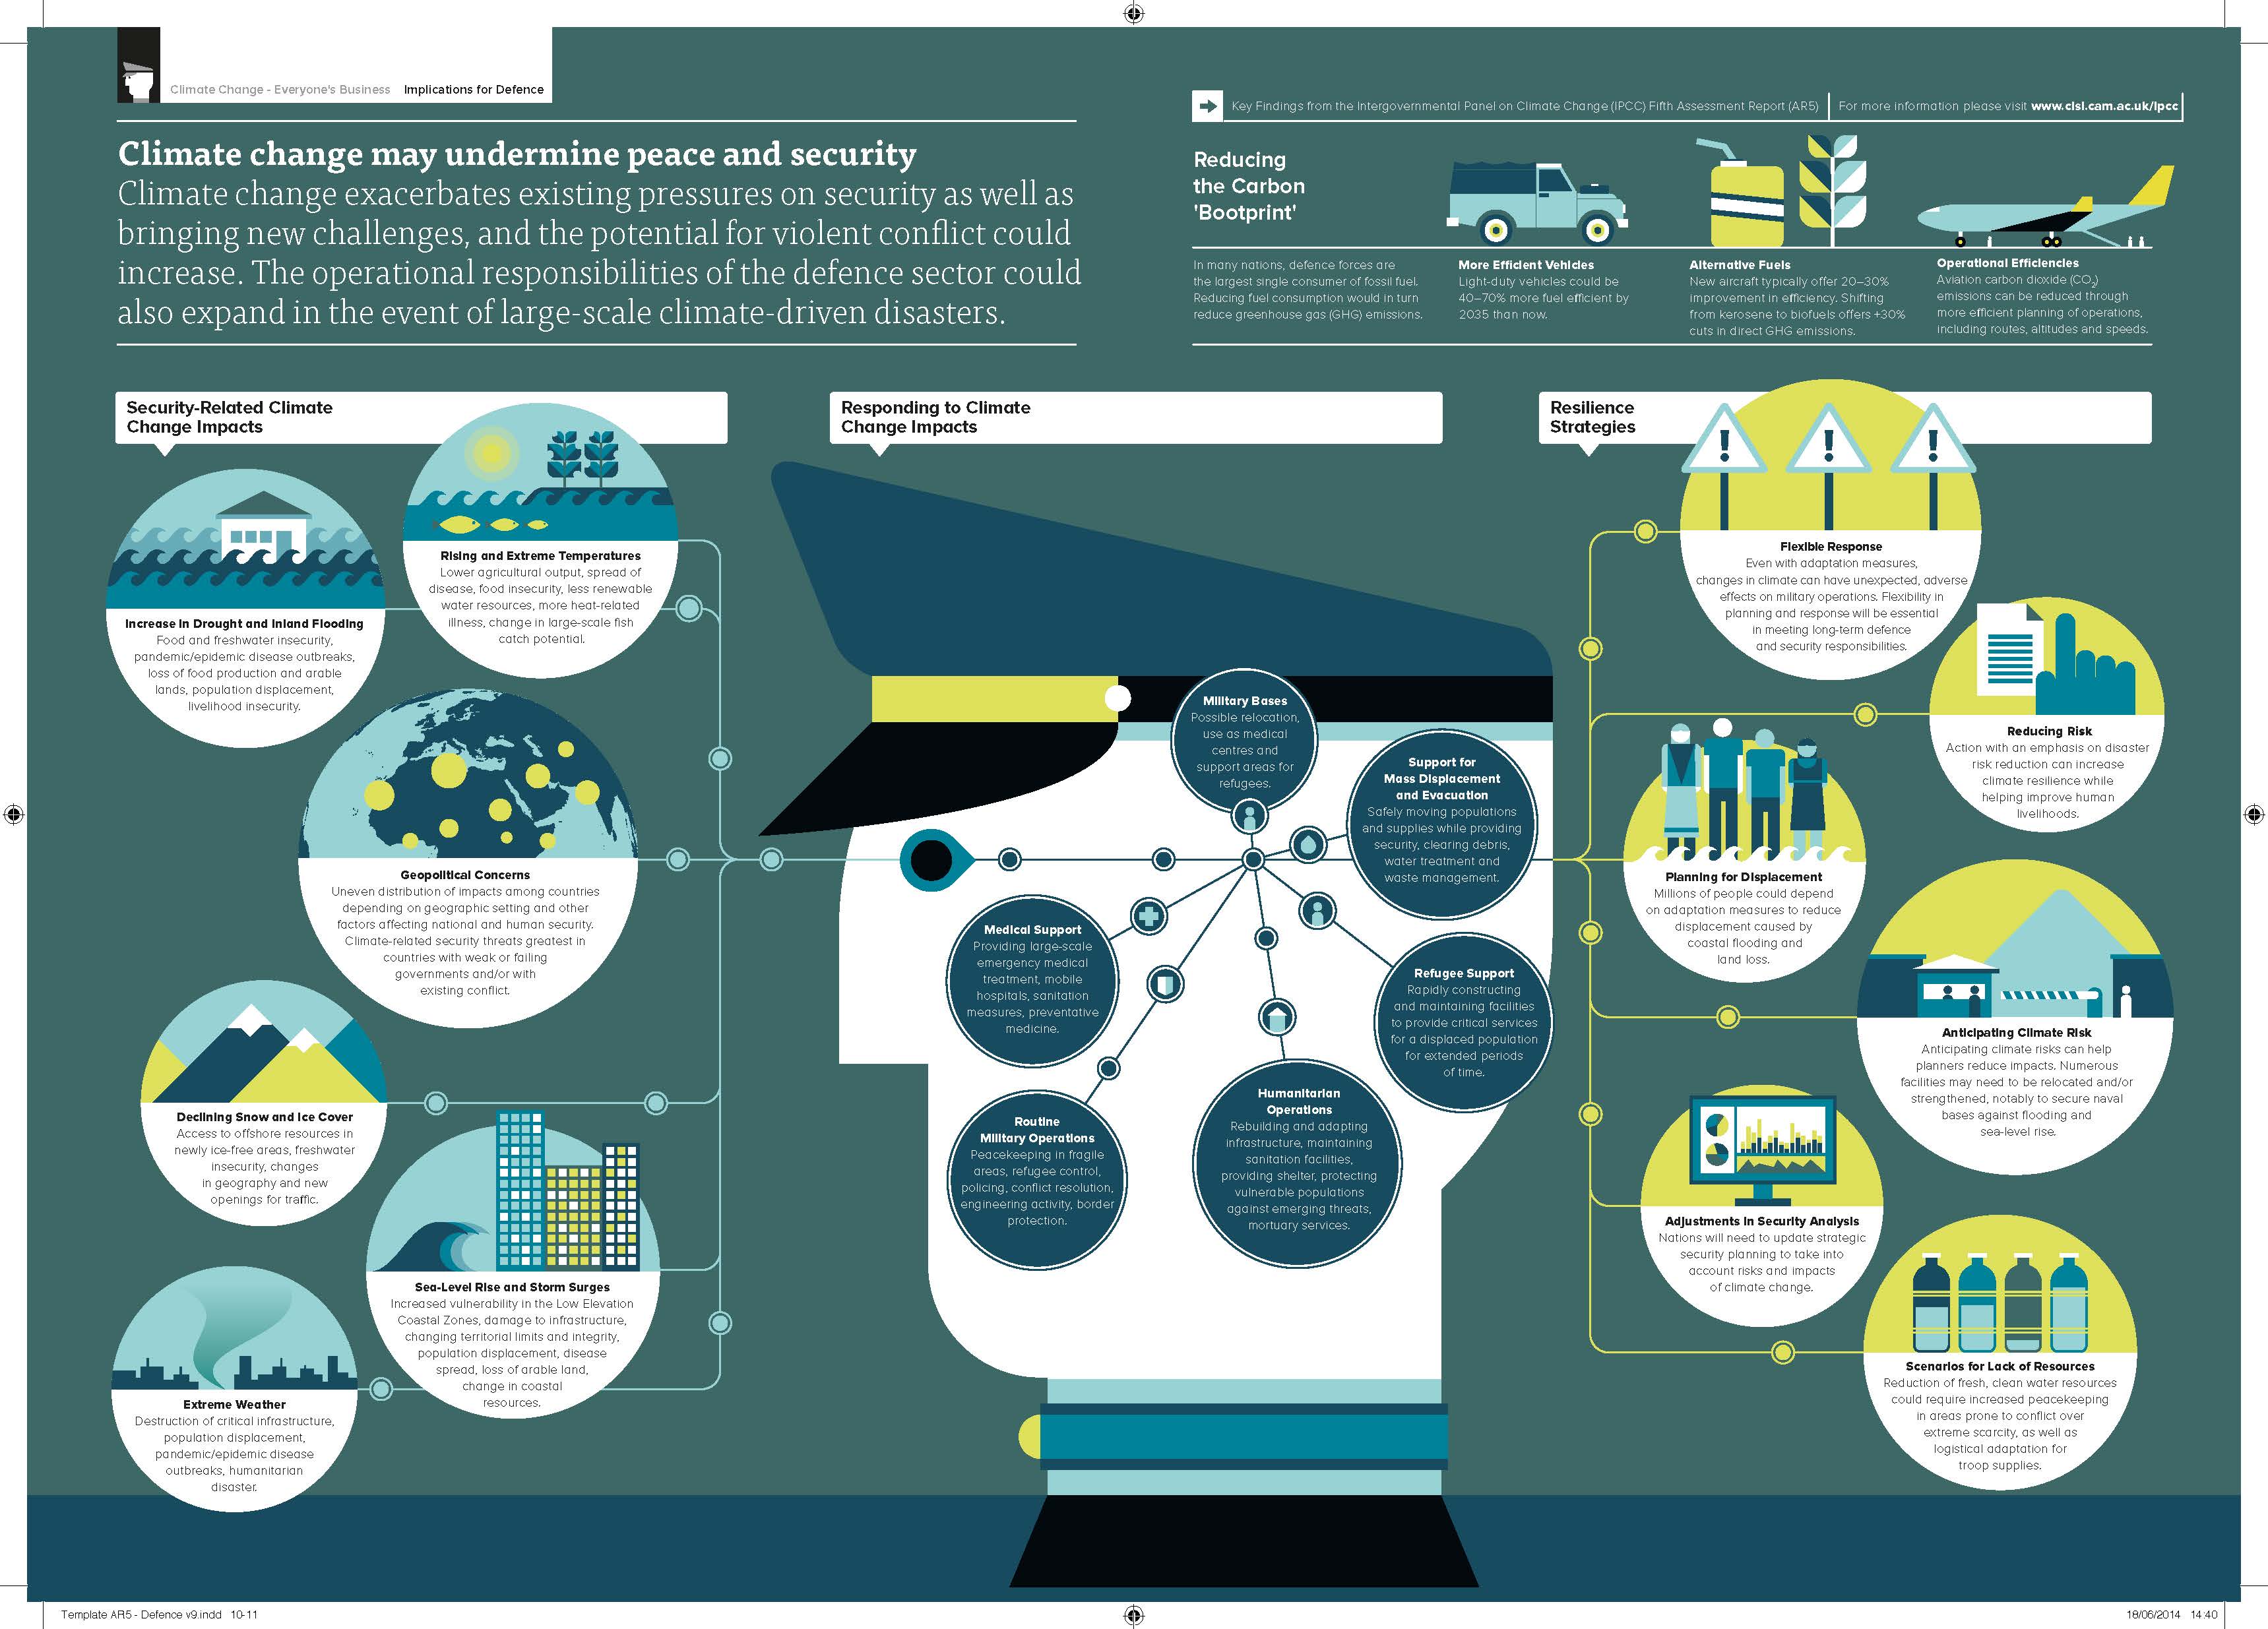
Implications For Defense |
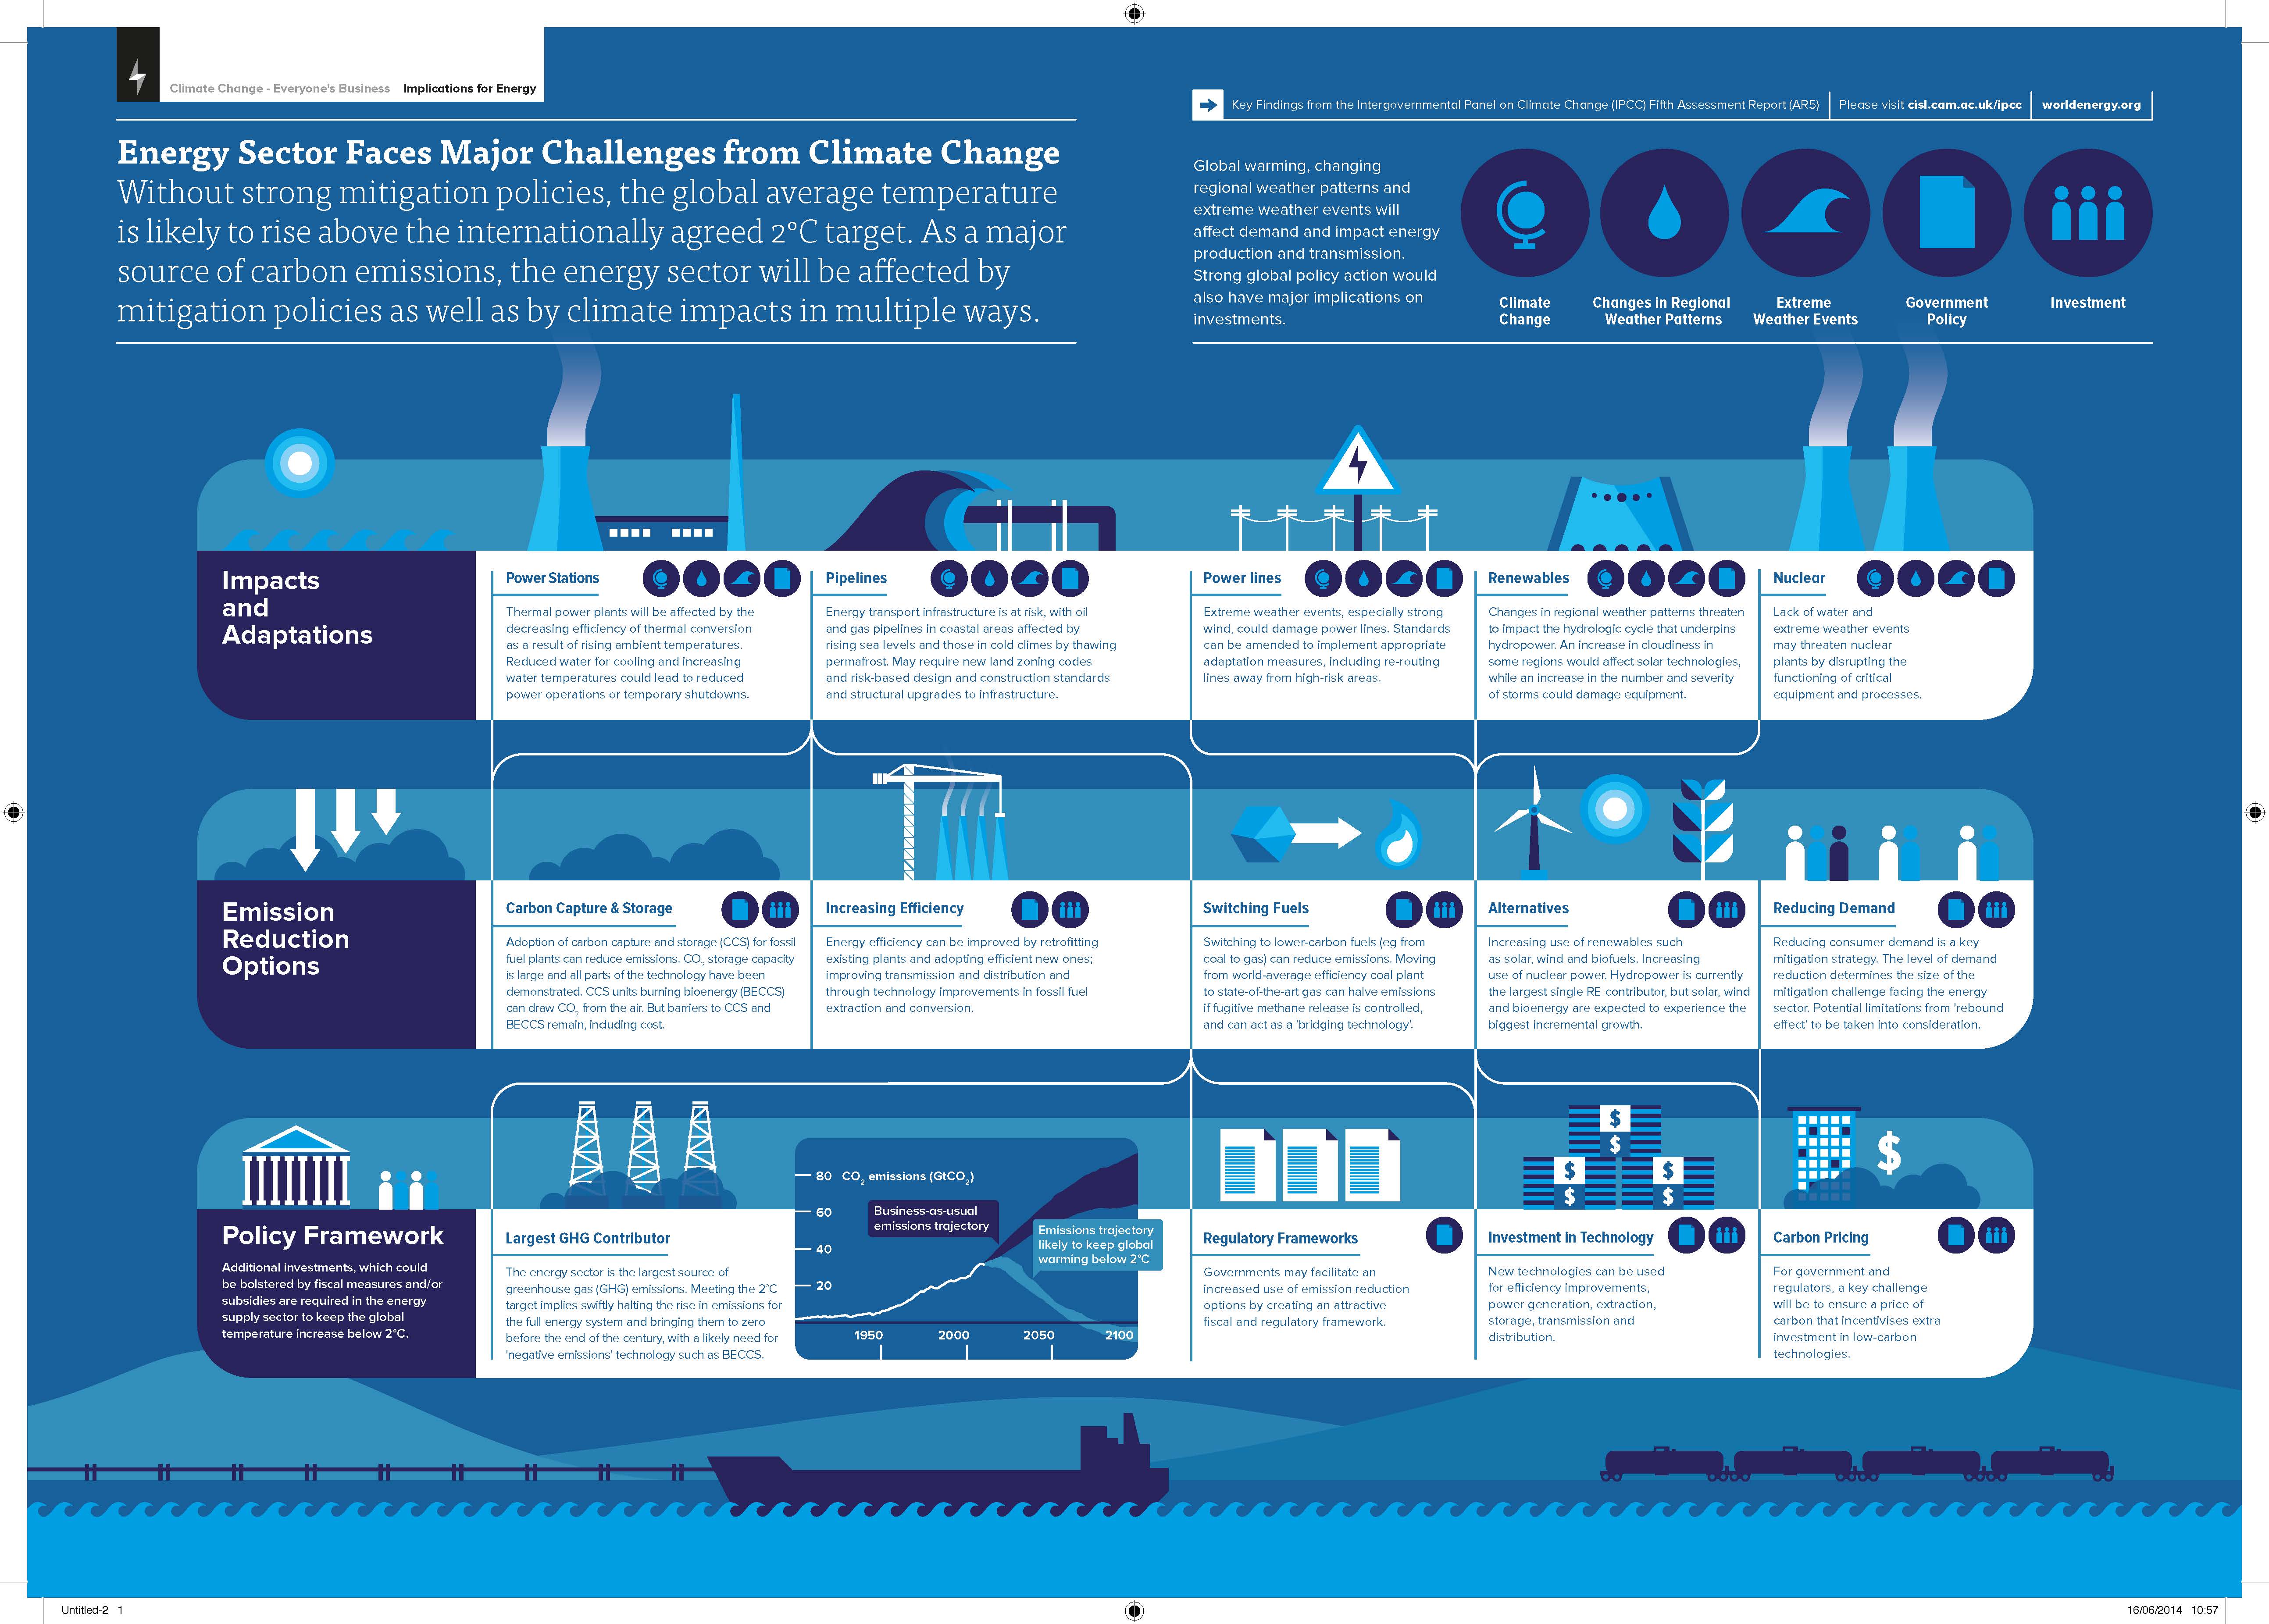
Implications For Energy |
Carbon Crossroads |
 |
 |
 |
 |
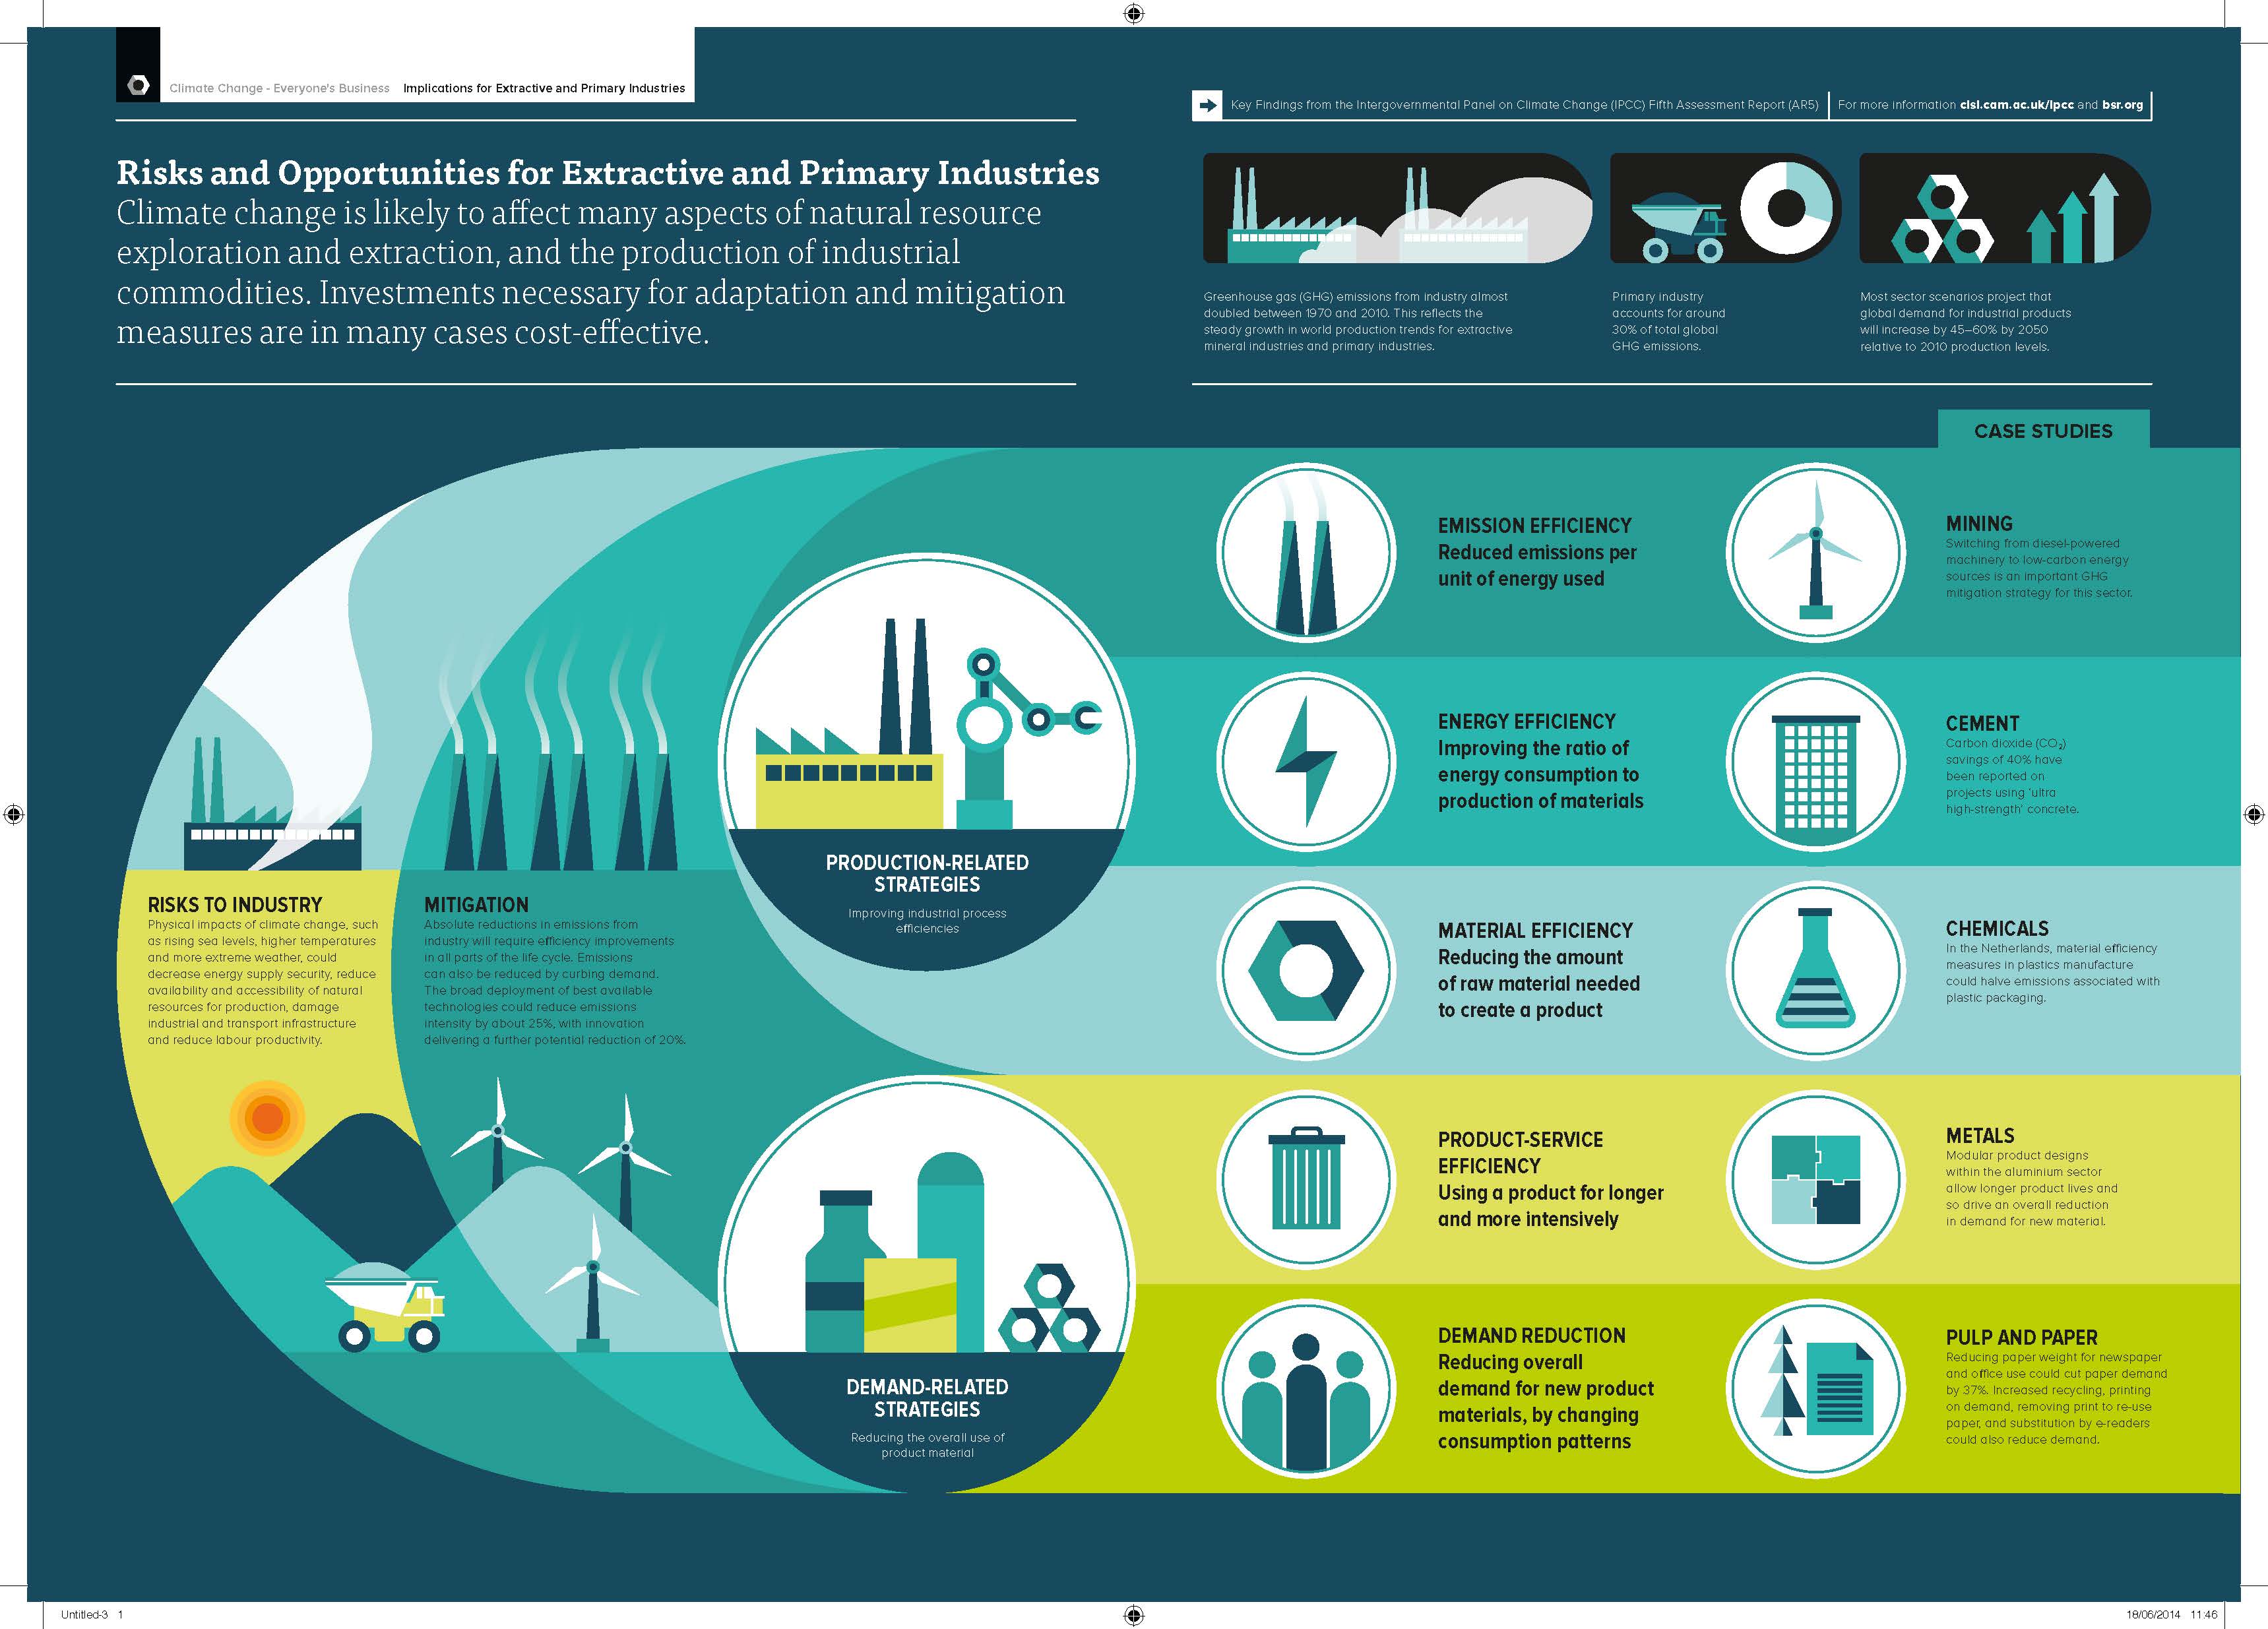
| Implications For Extractive & Primary Industries |
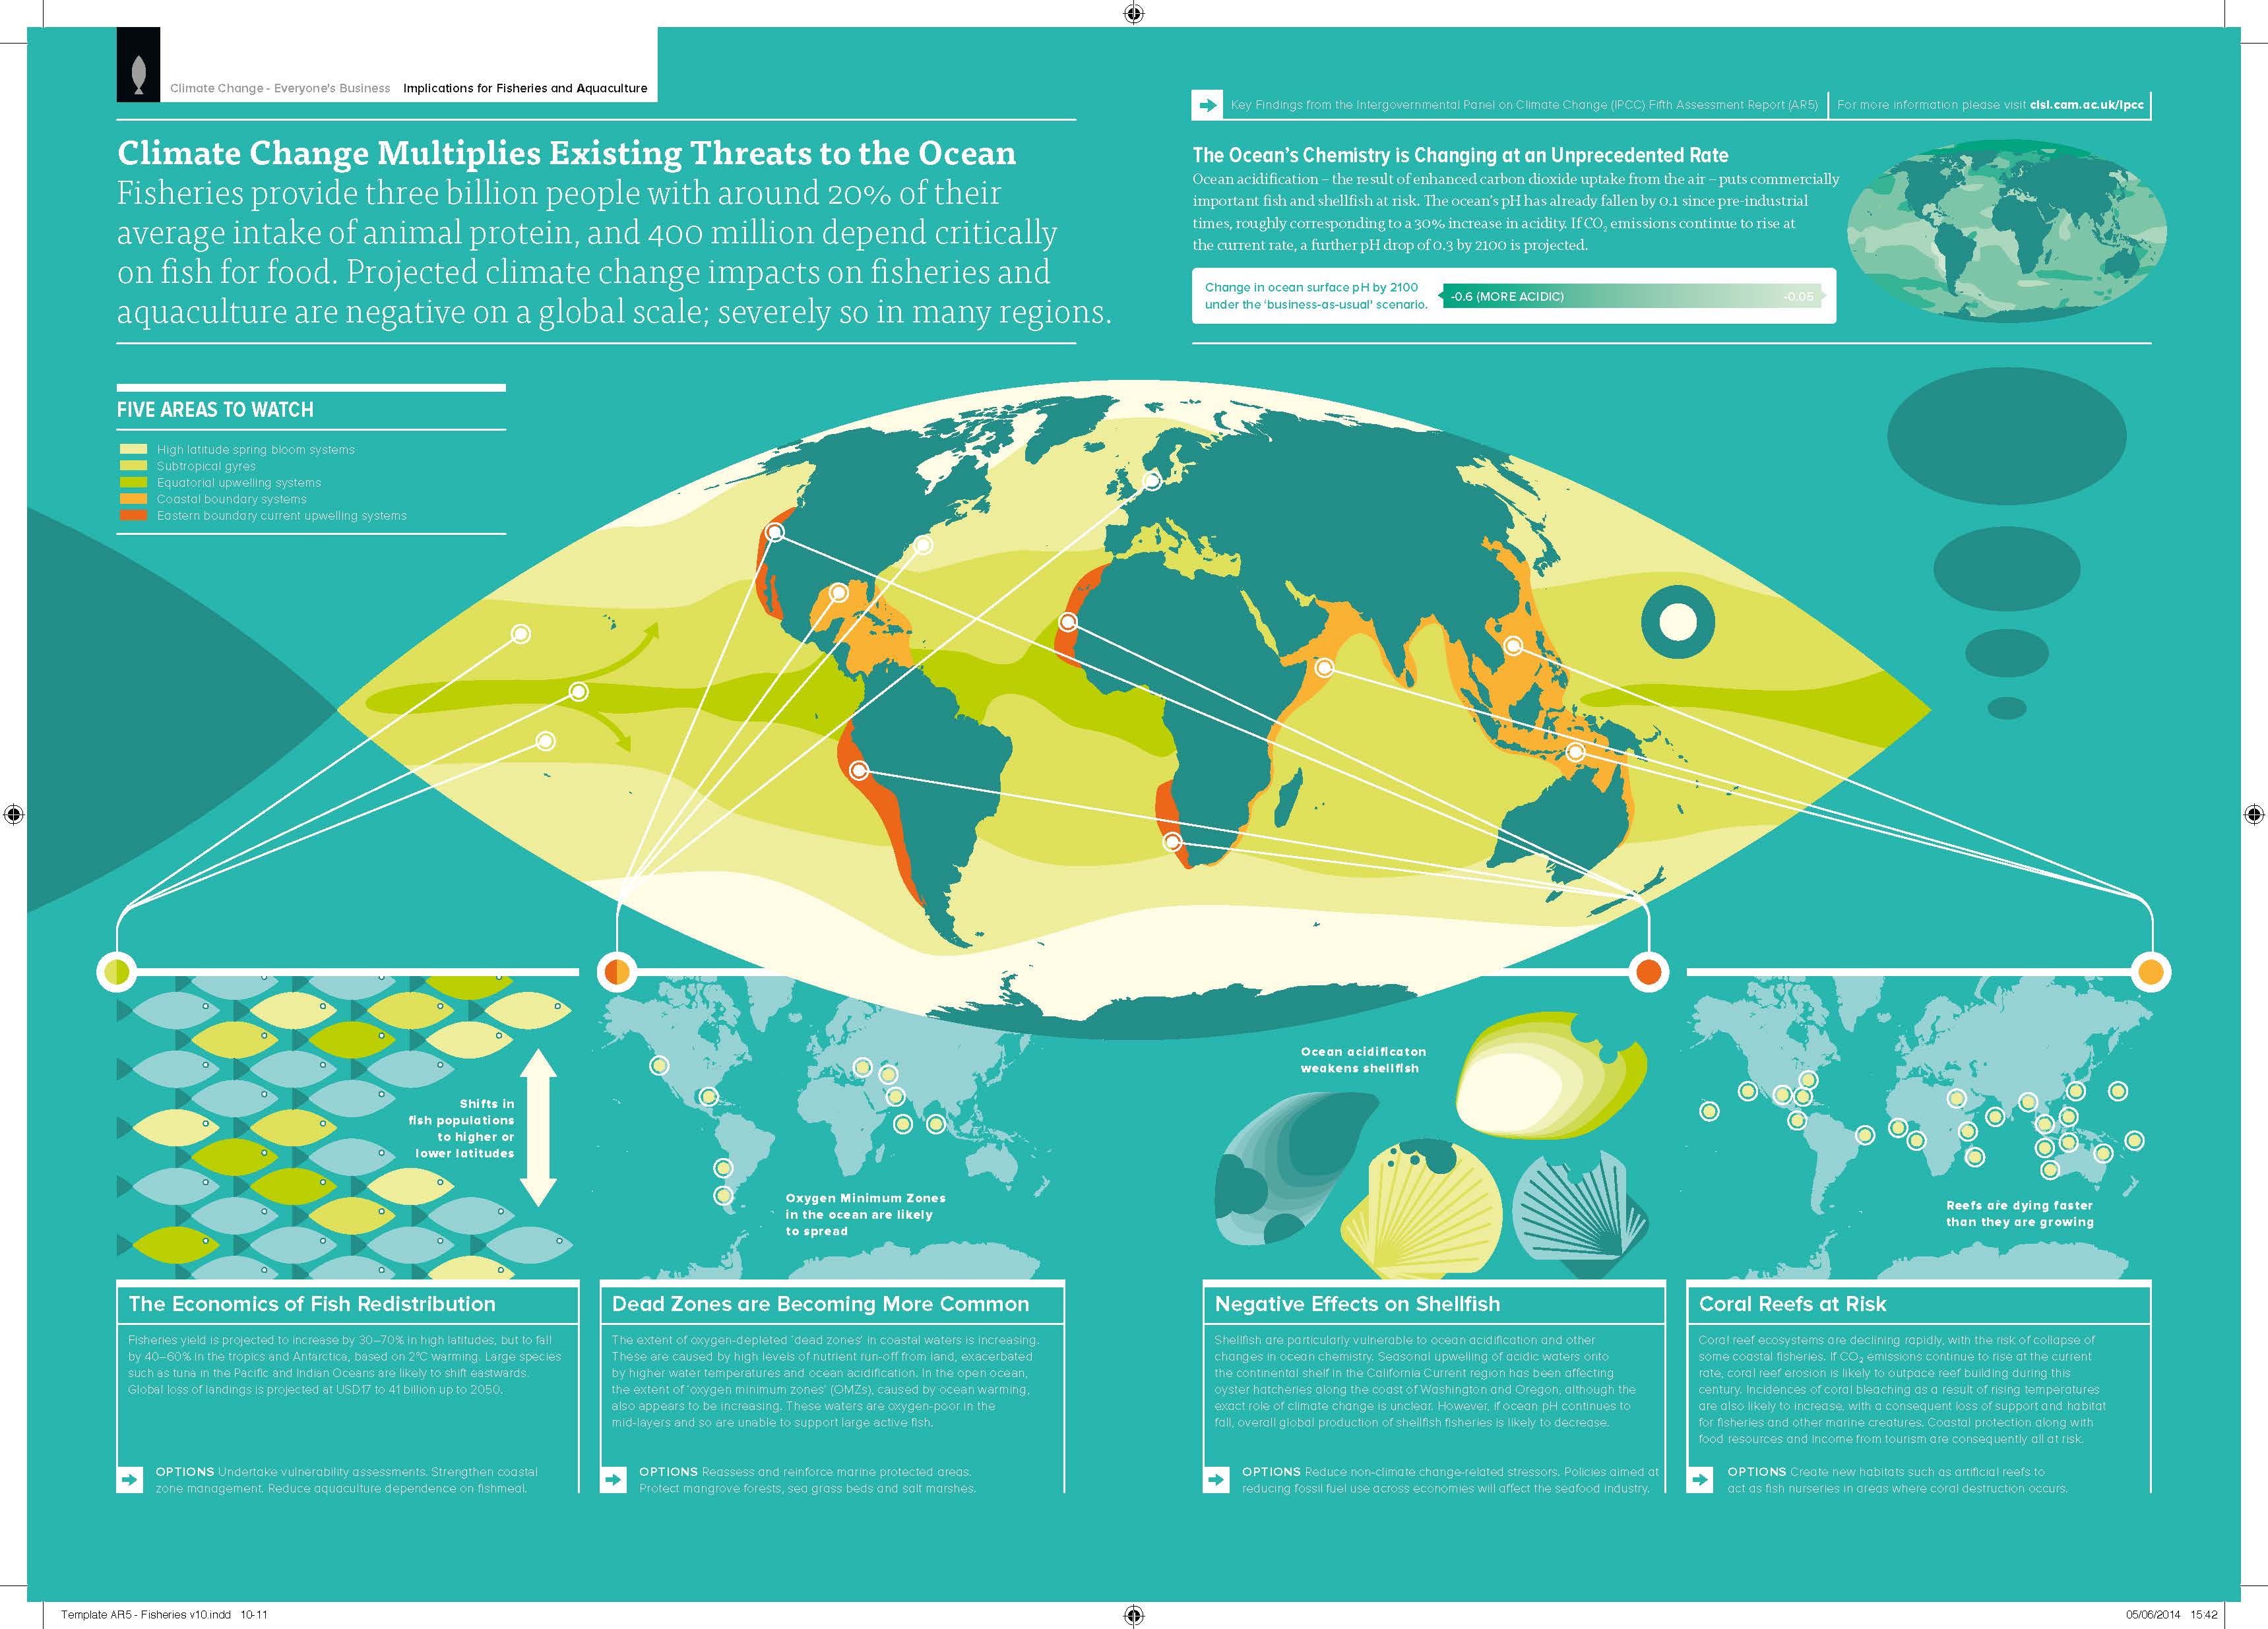
Implications For Fisheries & Aquaculture |
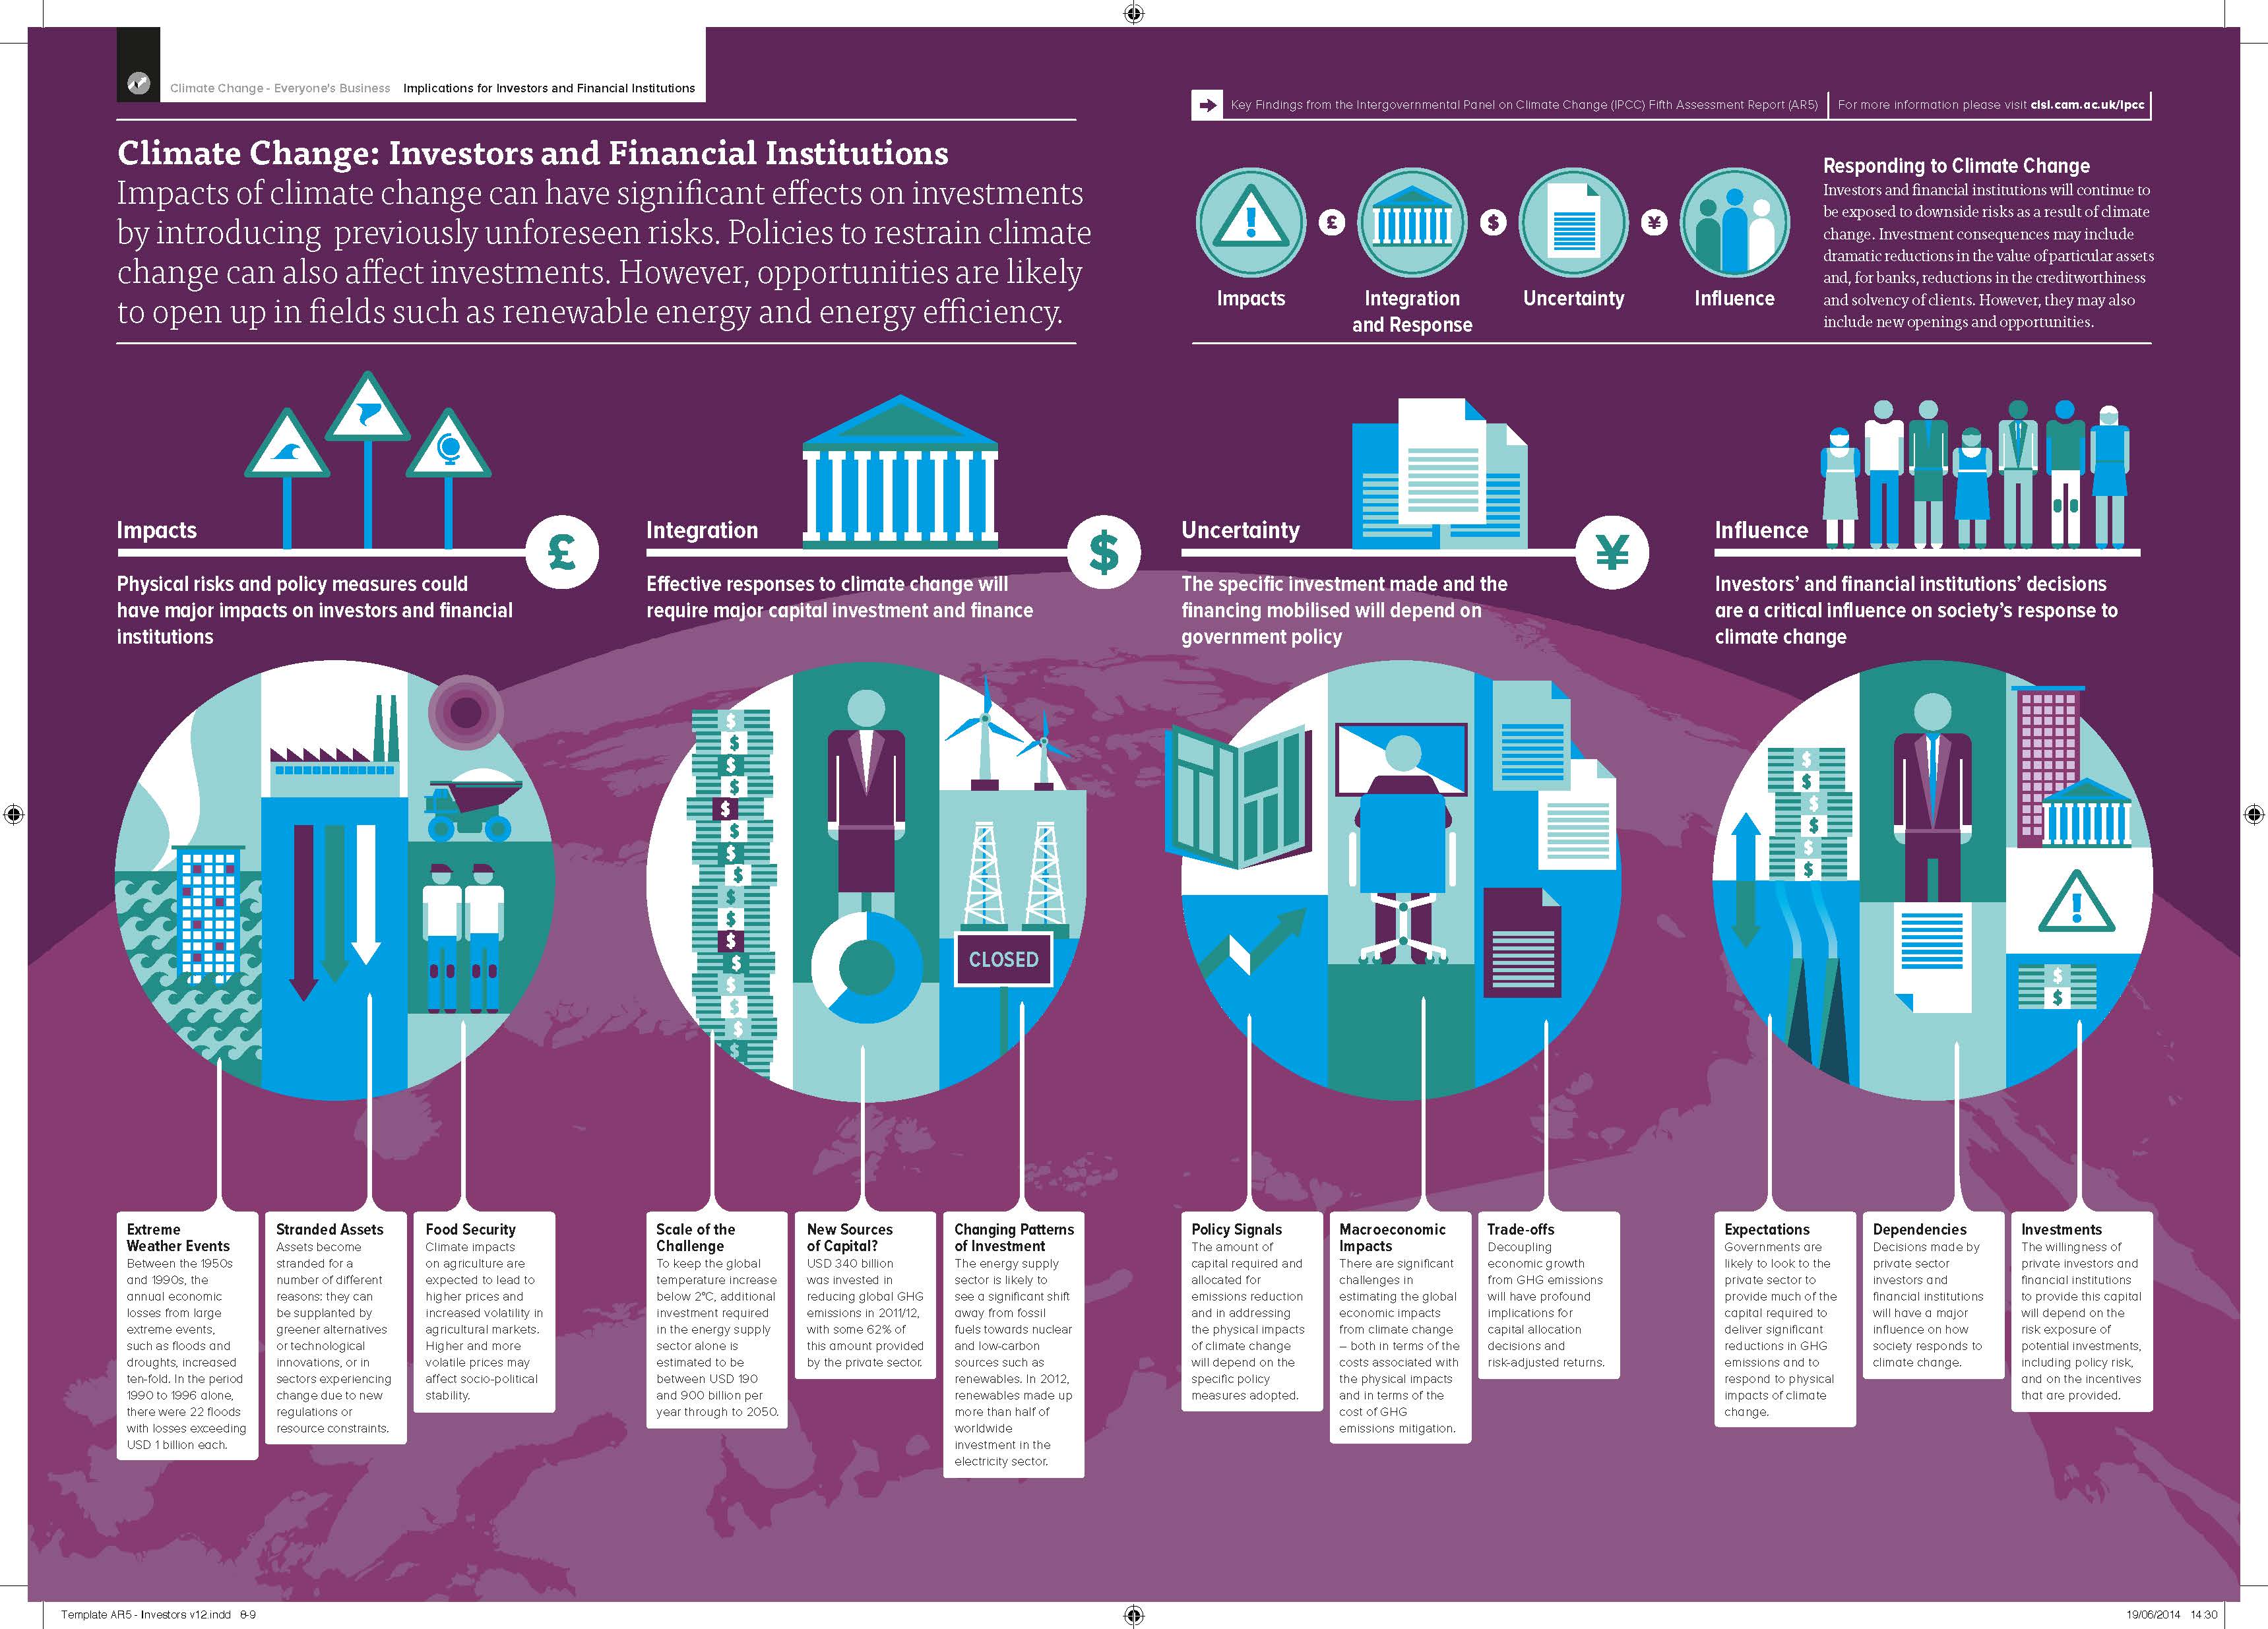
Implications For Investors |
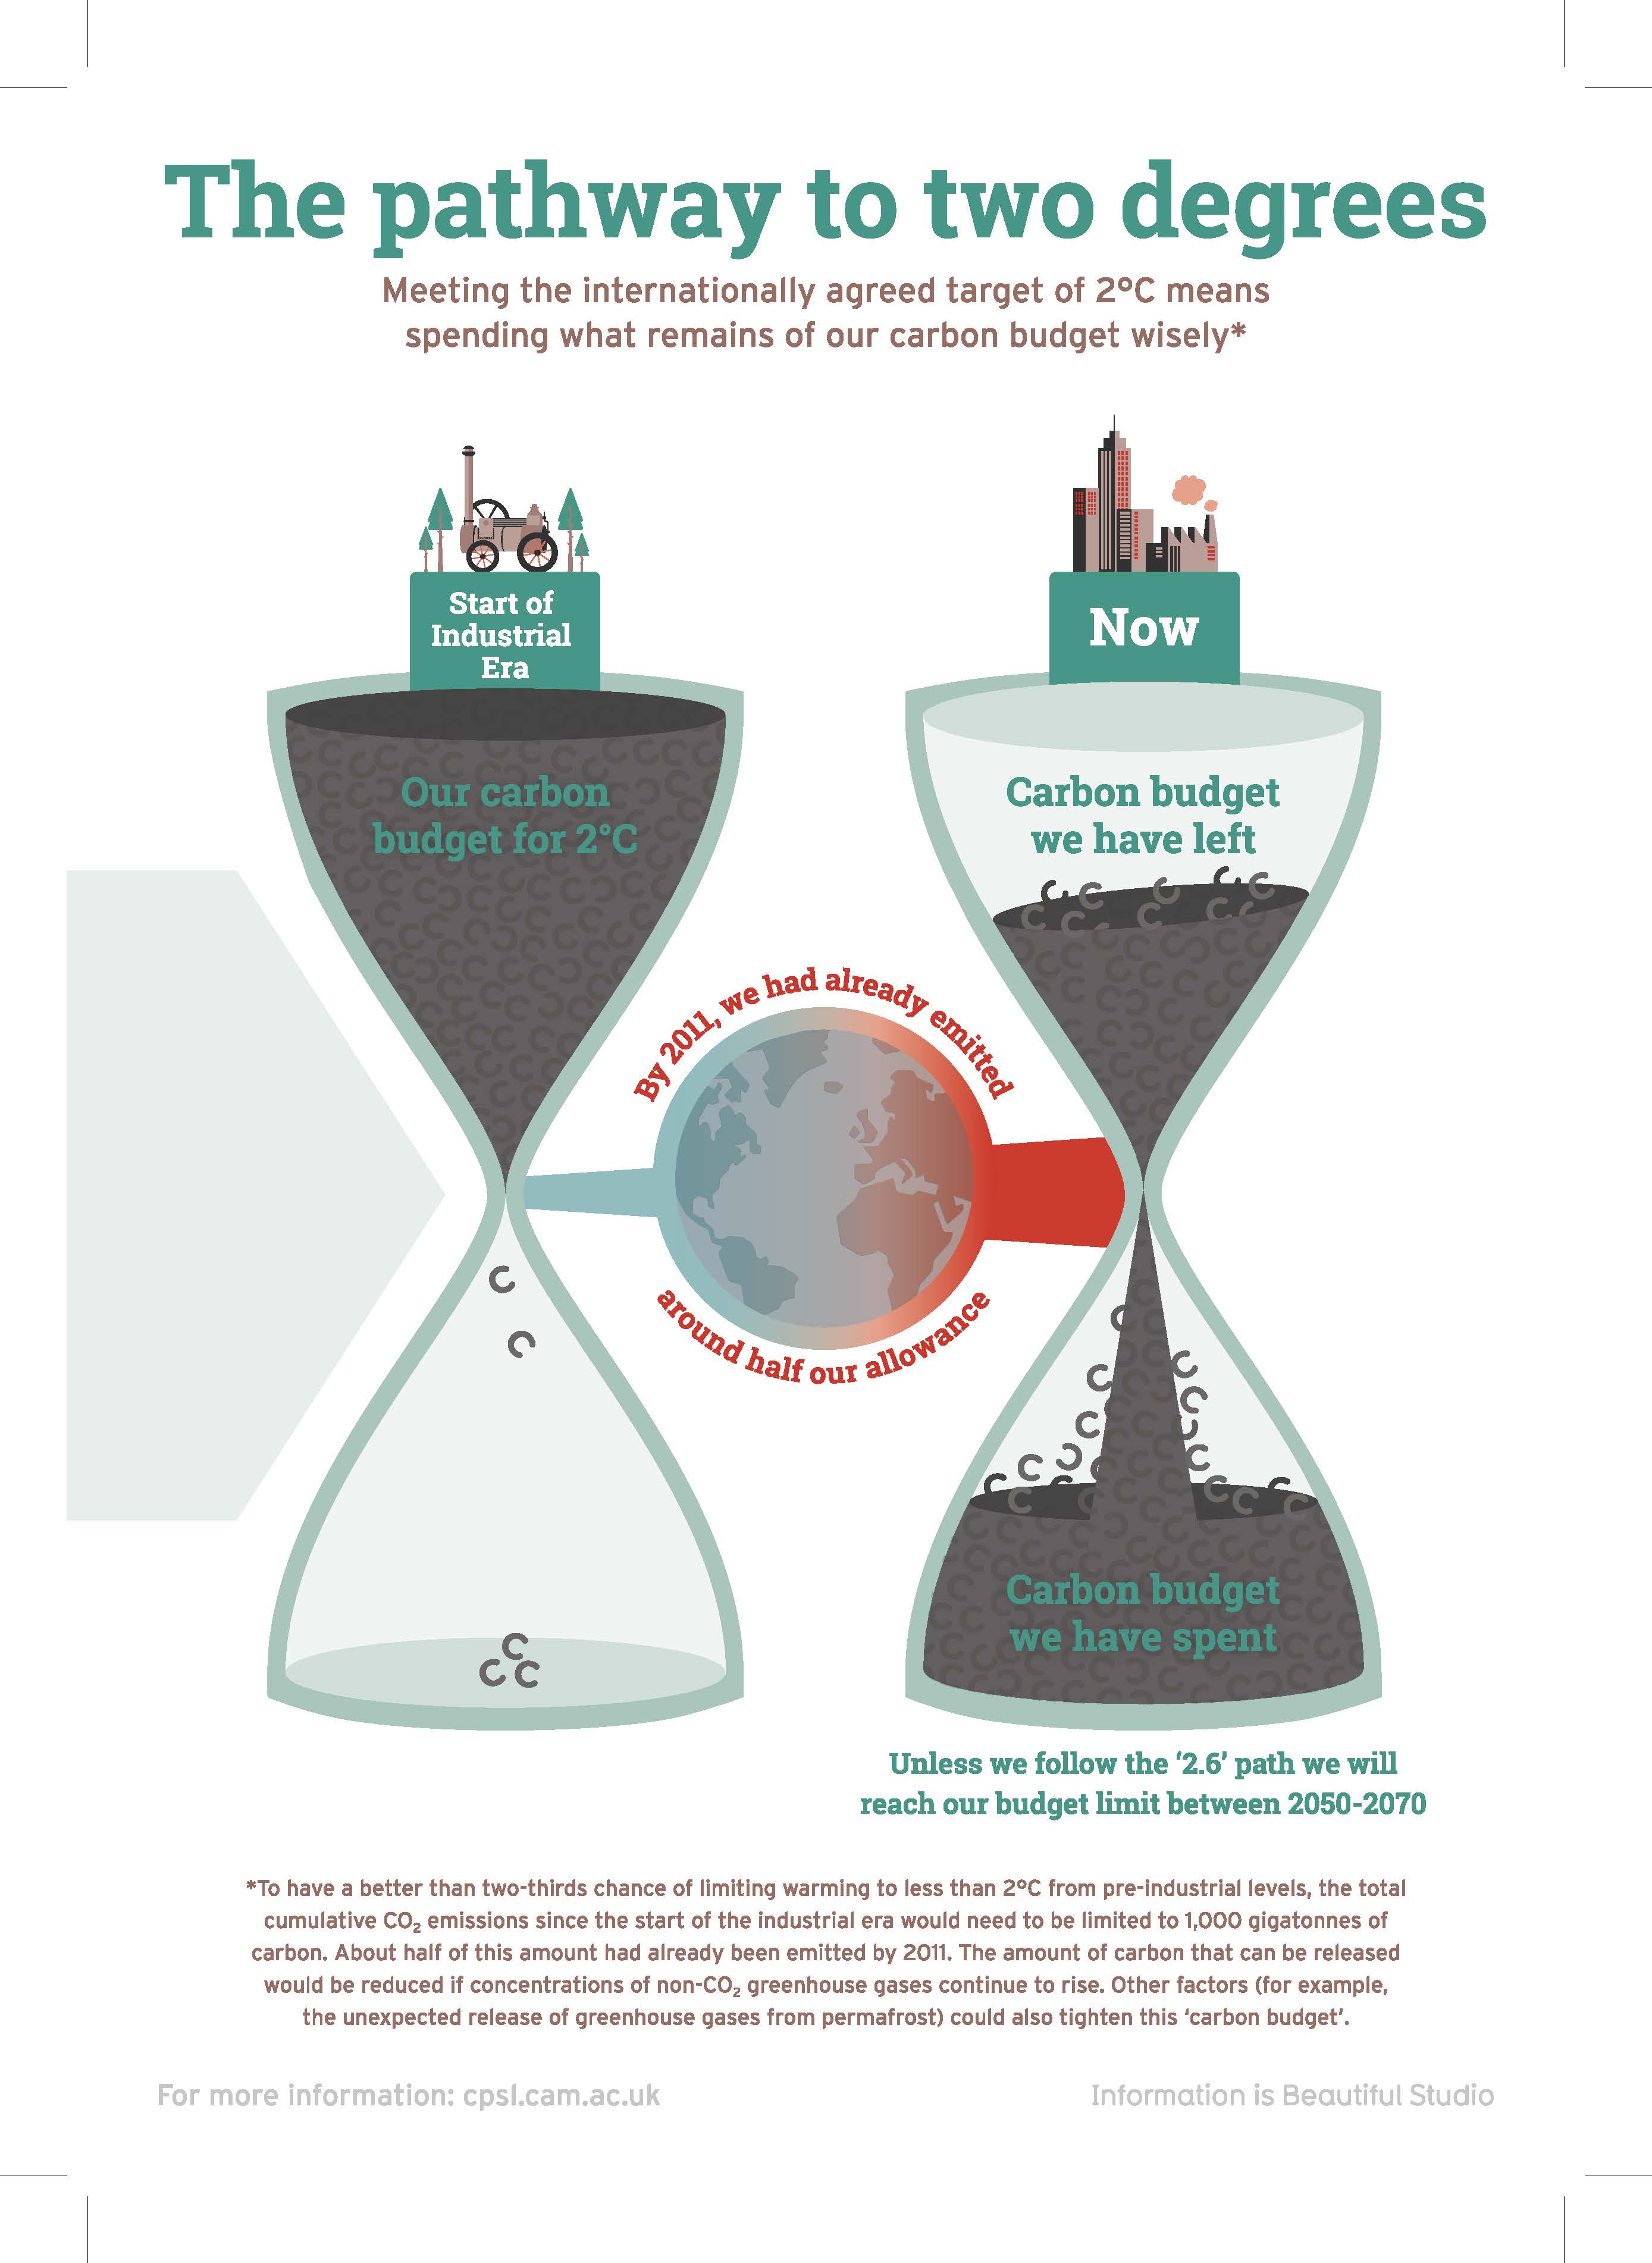
The Pathway To 2 Degrees |
 |
 |
 |
 |
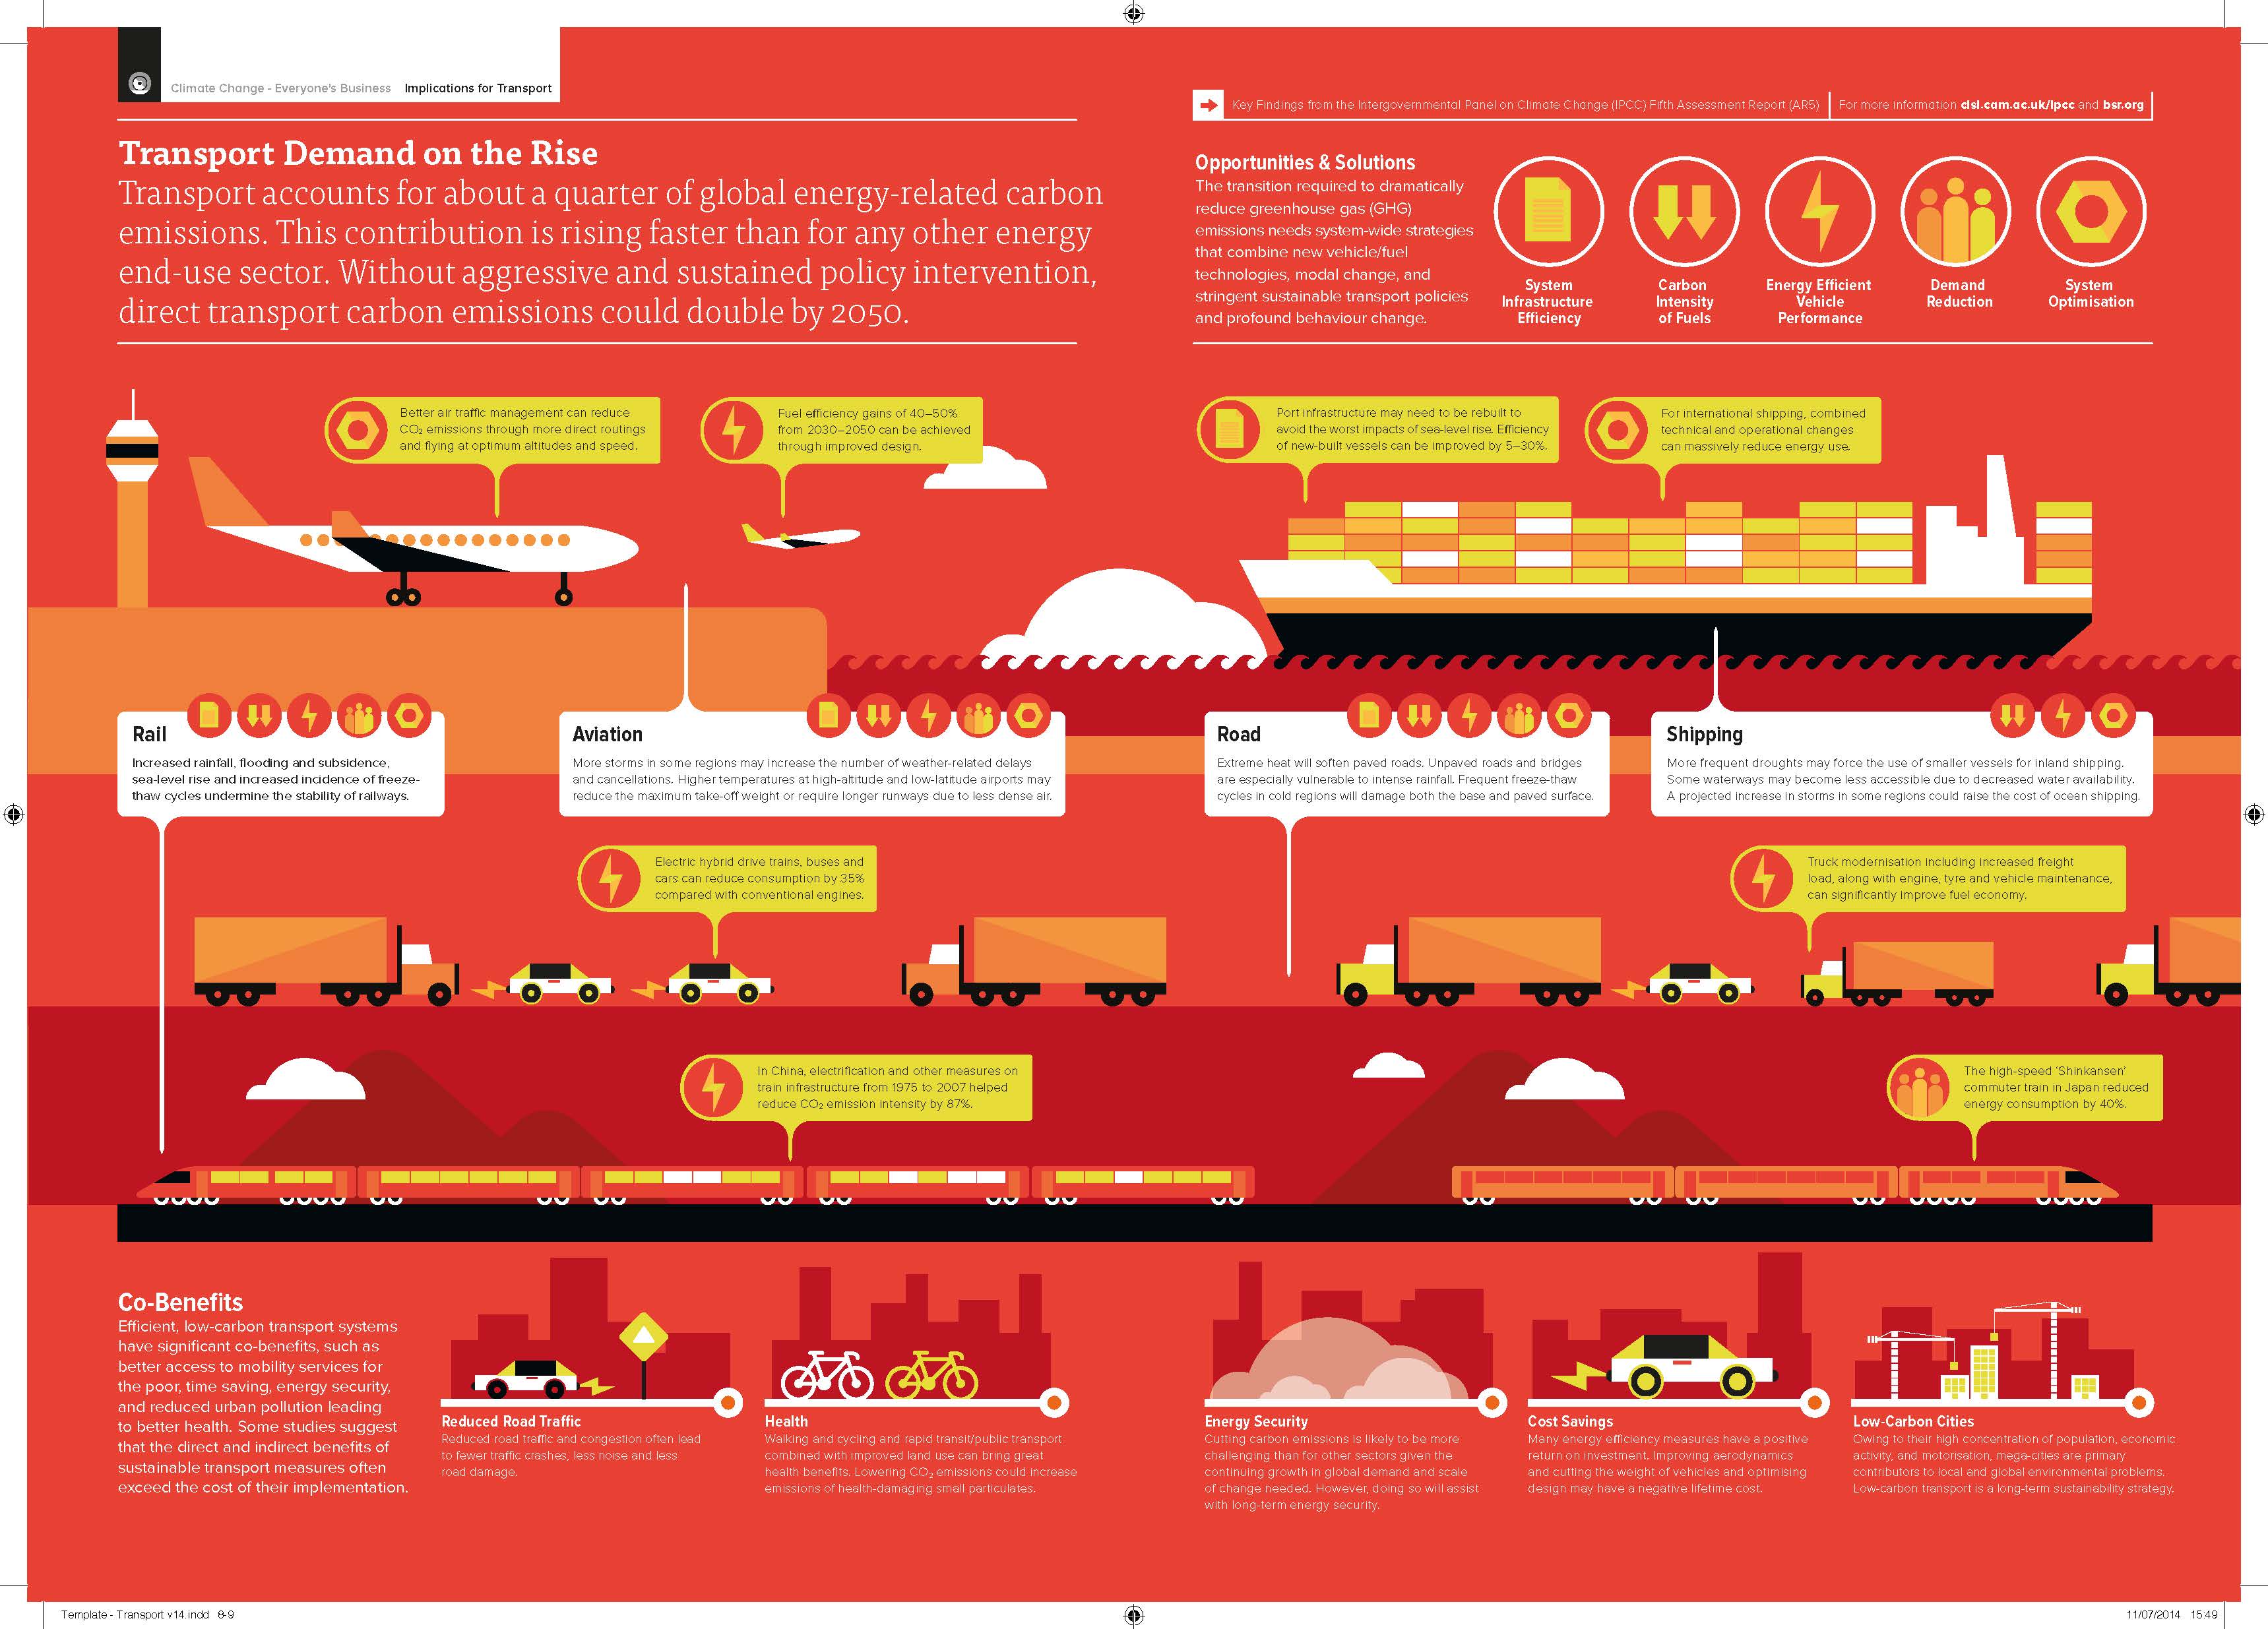
| Implications For Transport |
Implications For Tourism |
||
 |
 |
Source: University of Cambridge